TTEC (NASDAQ)
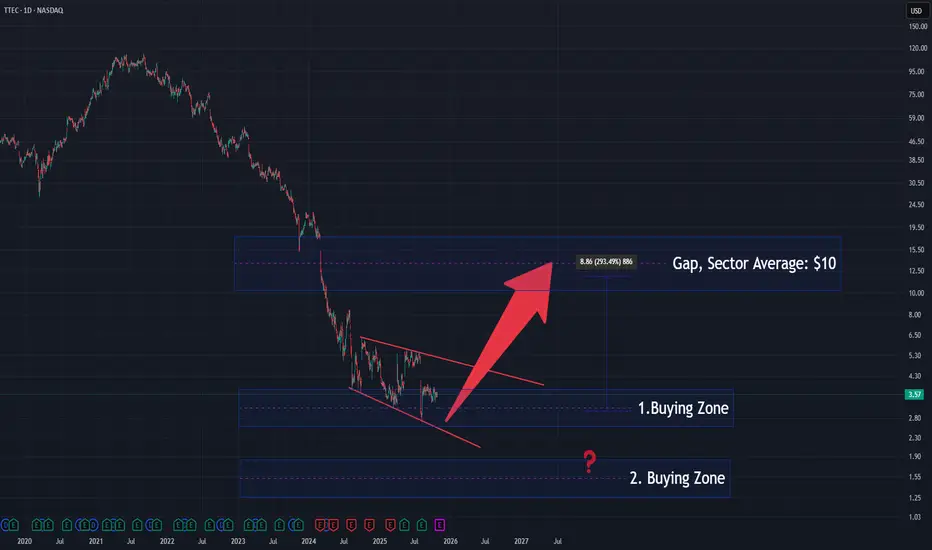
The price structure is forming a descending diagonal, suggesting a potential exhaustion phase of the ongoing downtrend.
The stock is currently trading inside the 1st Buying Zone, with a possible deeper test toward the 2nd Buying Zone before a sustained reversal begins.
The sector average stands near $10, aligning with the gap area, which could act as a major upside target if accumulation continues.
📈 A confirmed breakout from the diagonal pattern would strengthen the bullish bias toward that sector-level equilibrium.
💼 Professional market insights & charts:
cakirinsights.com/
cakirinsights.com/
Thông báo miễn trừ trách nhiệm
Thông tin và ấn phẩm không có nghĩa là và không cấu thành, tài chính, đầu tư, kinh doanh, hoặc các loại lời khuyên hoặc khuyến nghị khác được cung cấp hoặc xác nhận bởi TradingView. Đọc thêm trong Điều khoản sử dụng.