Here's the explanation.
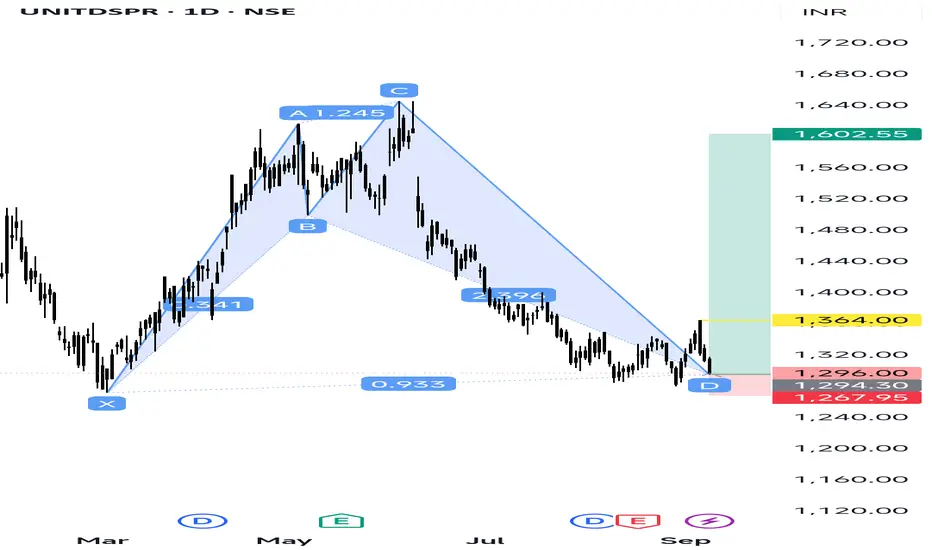
X to A: Initial strong rally.
A to B: Price retraced to ~0.886 of XA (fits Shark criteria).
B to C: A strong bullish move – extended to above 1.13 of AB.
C to D: A deep retracement, falling back close to 0.886–1.13 zone of XA → forming the Potential Reversal Zone (PRZ).
Now, the price is sitting around D (1296), which is the completion zone.
---
🔹 Trading Plan (General)
1. Entry:
Around Point D (1290–1300 zone) if reversal signs (bullish candles, RSI divergence, volume support) are visible.
2. Targets:
T1 → 1364 (first resistance / yellow line on chart)
T2 → 1500–1520
T3 → 1602 (green zone marked)
3. Stop Loss:
Below 1267 (red zone marked). If price closes below, pattern fails.
Thông báo miễn trừ trách nhiệm
Thông tin và ấn phẩm không có nghĩa là và không cấu thành, tài chính, đầu tư, kinh doanh, hoặc các loại lời khuyên hoặc khuyến nghị khác được cung cấp hoặc xác nhận bởi TradingView. Đọc thêm trong Điều khoản sử dụng.
Thông báo miễn trừ trách nhiệm
Thông tin và ấn phẩm không có nghĩa là và không cấu thành, tài chính, đầu tư, kinh doanh, hoặc các loại lời khuyên hoặc khuyến nghị khác được cung cấp hoặc xác nhận bởi TradingView. Đọc thêm trong Điều khoản sử dụng.