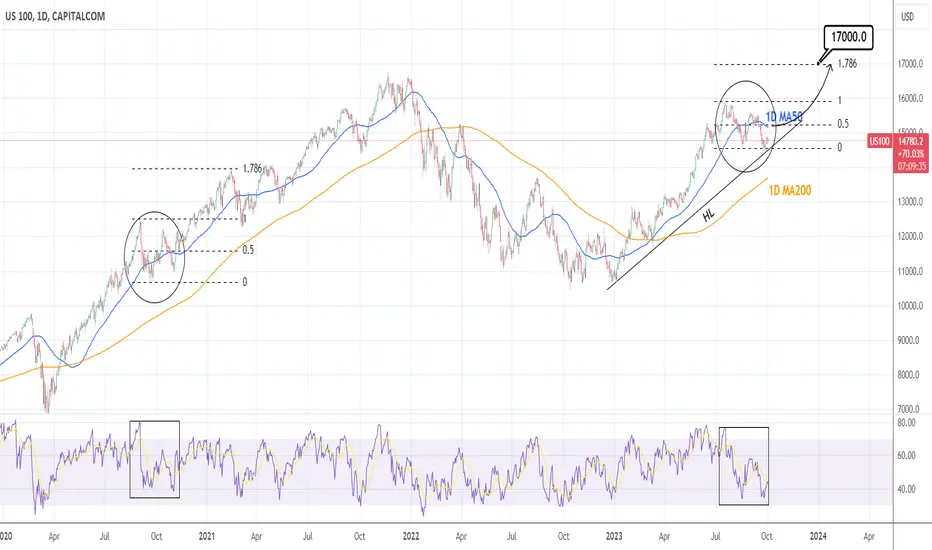
Nasdaq remains bearish on the 1D timeframe (RSI = 40.412, MACD = -138.180, ADX = 35.654) but it is on the HL trendline, the supporting trendline that emerged on the December 28th 2022 low. According to the 1D RSI, comparisons can be made with the September-October 2020 consolidation fractal around the 1D MA50, following the COVID recovery. After the 1D MA50 got crossed over for the second time, the index went on to reach the 1.786 Fibonacci extension level before the next consolidation.
If the HL holds and the index breaks over the 1D MA50 again, we will have a strong long term bullish case in our hands and target 17,000 (Fibonacci 1.786).
## If you like our free content follow our profile to get more daily ideas. ##
## Comments and likes are greatly appreciated. ##
If the HL holds and the index breaks over the 1D MA50 again, we will have a strong long term bullish case in our hands and target 17,000 (Fibonacci 1.786).
## If you like our free content follow our profile to get more daily ideas. ##
## Comments and likes are greatly appreciated. ##
Telegram: t.me/investingscope
investingscope.com
Over 65% accuracy on Private Signals Channel.
Over 15% return monthly on our Account Management Plan.
Account RECOVERY services.
Free Channel: t.me/investingscopeofficial
investingscope.com
Over 65% accuracy on Private Signals Channel.
Over 15% return monthly on our Account Management Plan.
Account RECOVERY services.
Free Channel: t.me/investingscopeofficial
Thông báo miễn trừ trách nhiệm
Thông tin và ấn phẩm không có nghĩa là và không cấu thành, tài chính, đầu tư, kinh doanh, hoặc các loại lời khuyên hoặc khuyến nghị khác được cung cấp hoặc xác nhận bởi TradingView. Đọc thêm trong Điều khoản sử dụng.