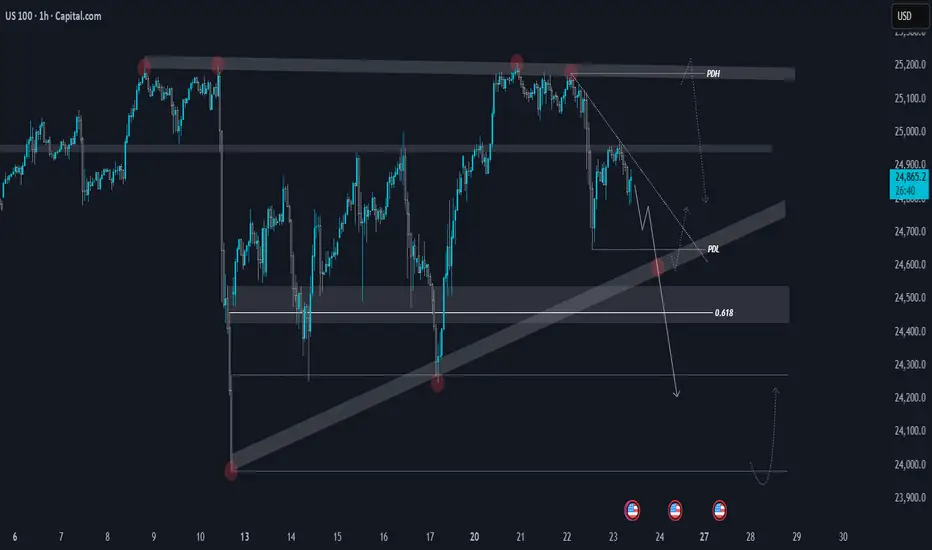
On the 4H timeframe, the index is approaching the trendline support around 24,600, which marks the third touch of this level. If this zone fails to hold, we could see an extended move toward the 24,000 area.
From a broader view, the daily chart shows a double top pattern along with a strong bearish divergence — both supporting a deeper pullback. However, a daily close above 25,220 would invalidate this view and could shift momentum back to the upside.
📰 With the ongoing U.S. government shutdown and heightened market uncertainty, sentiment remains mixed. Volatility is expected to stay elevated, so it’s best to wait for clear confirmation around key levels before taking any positions.
Bài đăng liên quan
Thông báo miễn trừ trách nhiệm
Thông tin và ấn phẩm không có nghĩa là và không cấu thành, tài chính, đầu tư, kinh doanh, hoặc các loại lời khuyên hoặc khuyến nghị khác được cung cấp hoặc xác nhận bởi TradingView. Đọc thêm trong Điều khoản sử dụng.
Bài đăng liên quan
Thông báo miễn trừ trách nhiệm
Thông tin và ấn phẩm không có nghĩa là và không cấu thành, tài chính, đầu tư, kinh doanh, hoặc các loại lời khuyên hoặc khuyến nghị khác được cung cấp hoặc xác nhận bởi TradingView. Đọc thêm trong Điều khoản sử dụng.