Giá lên
DOW JONES This is the bottom. Fractals from 2022 confirm.
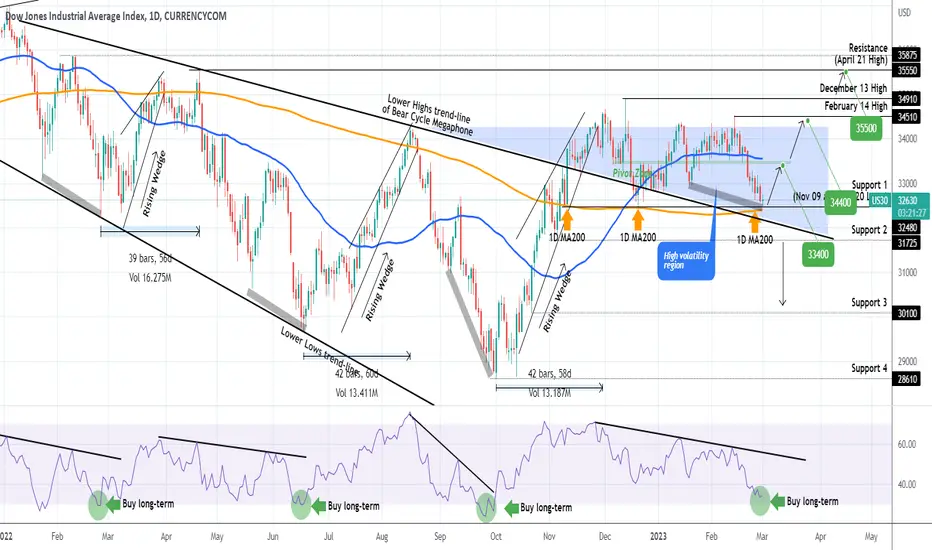
Not surprisingly to us, Dow Jones has stayed inside the High Volatility region that we have identified back in late November:

The 1D MA200 (orange trend-line) has supported twice already since November 10 and is now going for its 3rd hold. If we pay a closer attention to the 1D RSI we see that it has printed the very same pattern it made on all Lows during the 2022 Bear Cycle. That is basically 3 occasions. The RSI is very close to the 30.00 oversold barrier and as the 1D MA100 supports, it makes it the most optimal long-term buy level on a 2-month horizon.
Even though it has been mostly trading sideways within the High Volatility Zone, on RSI terms, it is comparable to all 2022 Lows that bottomed out on an oversold 30.00 1D RSI and started an aggressive rally in the form of a Rising Wedge.
Our Targets are: short-term = 33400 (Pivot Zone), medium-term = 34400 (February 14 Resistance), long-term 35500 (April 21 Resistance).
-------------------------------------------------------------------------------
** Please LIKE 👍, FOLLOW ✅, SHARE 🙌 and COMMENT ✍ if you enjoy this idea! Also share your ideas and charts in the comments section below! **
-------------------------------------------------------------------------------
💸💸💸💸💸💸
👇 👇 👇 👇 👇 👇
👑Best Signals (Forex/Crypto+70% accuracy) & Account Management (+20% profit/month on 10k accounts)
💰Free Channel t.me/tradingshotglobal
🤵Contact info@tradingshot.com t.me/tradingshot
🔥New service: next X100 crypto GEMS!
💰Free Channel t.me/tradingshotglobal
🤵Contact info@tradingshot.com t.me/tradingshot
🔥New service: next X100 crypto GEMS!
Thông báo miễn trừ trách nhiệm
Thông tin và các ấn phẩm này không nhằm mục đích, và không cấu thành, lời khuyên hoặc khuyến nghị về tài chính, đầu tư, giao dịch hay các loại khác do TradingView cung cấp hoặc xác nhận. Đọc thêm tại Điều khoản Sử dụng.