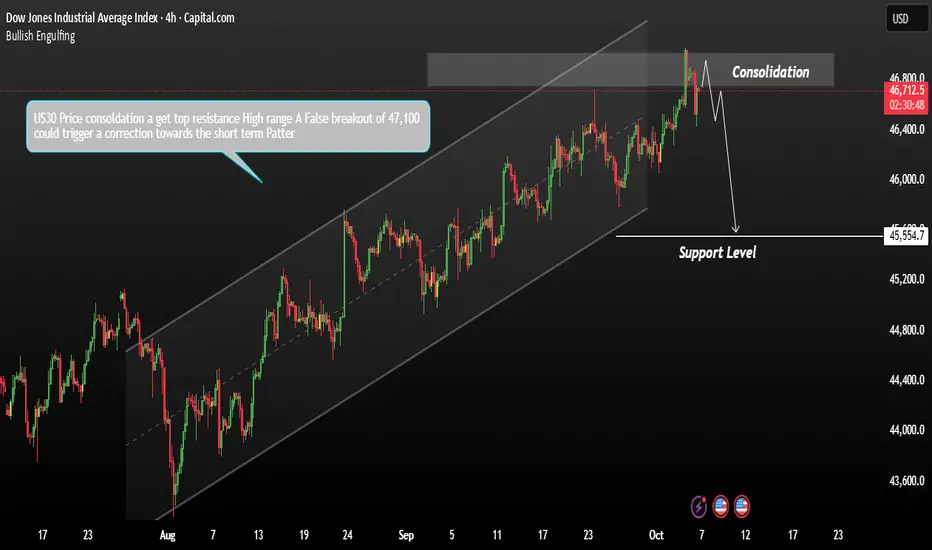
The US30 has recently shown strong consolidation near its top resistance zone, forming a new record high around 47,100. However, the breakout above this level appears to be losing momentum, raising the possibility of a false breakout.
If price fails to hold above 47,100 and shows signs of rejection, this could trigger a short-term corrective move each key support and resistance zone highlighted on the chart remains critical to watch. The market’s reaction — whether a clean breakout or a rejection — will likely determine the next directional move should the index respect the current resistance and reverse, the next significant short-term support to monitor is located near 45,500.
You may find more details in the chart.
Trade wisely best of luck.
Ps; Support with like and comments for better analysis Thanks for Supporting.
Giao dịch đang hoạt động
Join My telegram Channel
t.me/AnalysisGold2
Free Forex Signals
t.me/Jamessignals11
t.me/AnalysisGold2
Free Forex Signals
t.me/Jamessignals11
Bài đăng liên quan
Thông báo miễn trừ trách nhiệm
Thông tin và các ấn phẩm này không nhằm mục đích, và không cấu thành, lời khuyên hoặc khuyến nghị về tài chính, đầu tư, giao dịch hay các loại khác do TradingView cung cấp hoặc xác nhận. Đọc thêm tại Điều khoản Sử dụng.