Current Price: 46,785.30 | 4th October 2025, 12:54 AM UTC+4
EXECUTIVE SUMMARY
The Dow Jones Industrial Average is trading at 46,785.30, showing consolidation near all-time highs. Multi-timeframe analysis reveals a bullish trend with caution signals emerging on shorter timeframes. Key resistance at 47,000-47,200 zone presents a critical decision point for continuation versus correction.
Bottom Line: Bullish bias remains intact on daily/weekly charts, but intraday traders should watch for potential pullback to 46,500-46,300 support zone before next leg higher.
MULTI-TIMEFRAME MARKET STRUCTURE
Monthly/Weekly Context (Swing Trading)
Trend: Strong bullish momentum maintained since October 2023 lows
Elliott Wave Count: Potential Wave 5 of larger degree impulse, suggesting final push before correction
Key Levels: Major support at 45,800-46,000 (previous breakout zone); resistance at 47,200-47,500
Daily Chart Analysis
Structure: Higher highs and higher lows pattern intact
Ichimoku Cloud: Price trading above bullish cloud; Tenkan-sen/Kijun-sen bullish cross active
Pattern Recognition: Ascending channel formation with upper boundary at 47,150
4-Hour Chart (Critical Timeframe)
Candlestick Patterns: Recent doji and spinning tops indicating indecision
RSI: Divergence warning - price making higher highs while RSI shows lower highs (bearish divergence)
Volume Profile: Declining volume on recent push higher suggests weakening momentum
1-Hour/30-Minute (Intraday Focus)
Microstructure: Double top formation developing at 46,850-46,900 zone
Bollinger Bands: Price touching upper band with band width expanding
VWAP: Trading 0.2% above daily VWAP (46,692) - moderately extended
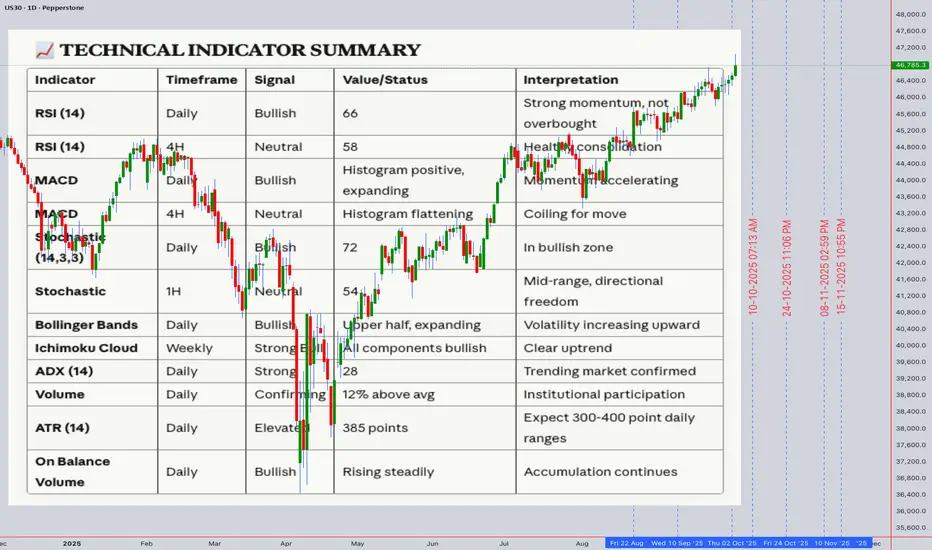
TECHNICAL INDICATOR DEEP DIVE
Momentum Indicators
RSI (14):
Daily: 62 (neutral-bullish)
4H: 58 (declining from 72 two days ago)
1H: 54 (bearish divergence present)
Interpretation: Momentum cooling after recent rally; not yet oversold
Trend Indicators
Moving Averages:
20 EMA: 46,580 (immediate support)
50 EMA: 46,200 (critical support)
200 EMA: 44,800 (long-term trend support)
Golden Cross Status: Active and bullish (50 MA above 200 MA)
Volatility Indicators
Bollinger Bands (20,2): Price at upper band; squeeze releasing suggests increased volatility ahead
ATR (14): 285 points (elevated) - expect 250-350 point daily ranges
Volume Analysis
Volume Weighted Average Price: 46,692
Volume Trend: Declining on up-moves (distribution warning)
Anchored VWAP: From October 1st low at 46,450 - price 0.7% above anchor
HARMONIC & PATTERN ANALYSIS
Gann Analysis
Square of 9: Next resistance at 47,088 (90° from current cycle low); support at 46,488
Gann Angles: 1x1 angle from September low projects support at 46,550
Time Cycles: October 8-10 represents potential reversal window (45-48 trading days from last pivot)
Harmonic Patterns
Potential Bat Pattern: Monitoring for completion at 46,950-47,000 (0.886 retracement level)
Fibonacci Confluence: 1.618 extension of recent corrective wave targets 47,150
Wyckoff Analysis
Phase: Appears to be in Distribution Phase B (preliminary supply)
Spring/Shakeout Watch: False breakout above 47,000 could trigger sell-off
Elliott Wave Count
Primary Count: Wave 5 of Intermediate (3), targeting 47,400-47,800
Alternate Count: Wave B corrective triangle forming; expect breakdown if 46,500 breaks
SUPPORT & RESISTANCE FRAMEWORK
Immediate Resistance Zones
46,850-46,900 - Intraday double top / psychological
47,000-47,050 - Major psychological / round number / Gann level
47,150-47,200 - Channel top / Fibonacci 1.618 / weekly pivot
47,500-47,600 - All-time high extension target
Support Zones
46,650-46,700 - VWAP / hourly demand zone
46,500-46,550 - 20 EMA / Gann 1x1 angle / pivot
46,200-46,300 - 50 EMA / gap fill / strong demand
45,800-46,000 - Daily cloud / major breakout point
TRAP SCENARIOS
Bull Trap Alert
Setup: Break above 47,000 with low volume followed by immediate reversal
Confirmation: Close below 46,800 same day with volume spike
Target: Retest 46,300-46,500 zone
Bear Trap Potential
Setup: Quick spike below 46,500 followed by rapid recovery
Confirmation: Close above 46,650 with strong volume
Target: Resume rally toward 47,200+
INTRADAY TRADING PLAN (October 4-11, 2025)
Day Trading Strategy - Scalp Setups
Bullish Scenario (60% Probability)
Entry Criteria:
Pullback to 46,650-46,700 with bullish engulfing or hammer on 15M chart
RSI (15M) reaches 40-45 oversold region
Volume contraction during pullback, expansion on reversal
Trade Setup:
Entry: 46,680-46,720
Stop Loss: 46,580 (100 points risk)
Target 1: 46,850 (130 points, 1.3:1 R/R) - scale out 50%
Target 2: 47,000 (280 points, 2.8:1 R/R) - scale out 30%
Target 3: 47,150 (430 points, 4.3:1 R/R) - let 20% run
Optimal Entry Times:
9:45-10:15 AM EST (post-opening volatility)
2:00-3:00 PM EST (afternoon momentum)
Bearish Scenario (40% Probability)
Entry Criteria:
Rejection at 46,900-47,000 with bearish engulfing on 15M/30M
RSI (15M) overbought above 70
Break below 46,780 (short-term support)
Trade Setup:
Entry: 46,760-46,800 (after break confirmation)
Stop Loss: 46,920 (120-160 points risk)
Target 1: 46,650 (110-150 points) - cover 50%
Target 2: 46,500 (260-300 points) - cover 30%
Target 3: 46,300 (460-500 points) - trail remainder
Optimal Entry Times:
10:30-11:00 AM EST (if morning rally fails)
3:00-3:45 PM EST (late-day profit taking)
SWING TRADING PLAN (1-4 Week Horizon)
Primary Swing Setup - Bullish Continuation
Entry Strategy:
Ideal Entry Zone: 46,300-46,500 (if pullback materializes)
Aggressive Entry: Current levels with 46,450 stop
Pattern: Bull flag/ascending channel continuation
Position Management:
Entry: 46,400 (scale in 30% at 46,500, 40% at 46,400, 30% at 46,300 if available)
Stop Loss: 46,100 (300 points, daily close below)
Target 1: 47,200 (700-800 points) - reduce 40%
Target 2: 47,800 (1,300-1,400 points) - reduce 30%
Target 3: 48,500 (2,000+ points) - trail with 50 EMA
Timeframe: 2-4 weeks
Confidence Level: 65%
Alternative Swing Setup - Mean Reversion Short
Activation Criteria:
Daily close below 46,500 with volume above 20-day average
RSI daily breaks below 50
Break of ascending trendline from September
Trade Setup:
Entry: 46,450-46,500 (after confirmation)
Stop Loss: 46,850 (350-400 points)
Target 1: 46,000 (450-500 points) - cover 50%
Target 2: 45,600 (850-900 points) - cover 30%
Target 3: 45,200 (1,250-1,300 points) - trail remainder
Timeframe: 1-3 weeks
Confidence Level: 35% (lower probability setup)
WEEKLY ROADMAP (October 4-11)
Monday-Tuesday (Oct 6-7):
Expected Range: 46,500-47,100
Bias: Neutral to bullish - watch for pullback completion
Key Level: 46,700 (holding above maintains bullish structure)
Wednesday-Thursday (Oct 8-9):
Gann Time Window: Potential reversal period
Strategy: Reduce position size; let patterns develop
Watch: Economic data releases could spike volatility
Friday (Oct 10):
Weekly Close: Critical for swing positioning
Bullish Confirmation: Close above 46,850
Bearish Warning: Close below 46,600
RISK MANAGEMENT GUIDELINES
Position Sizing
Intraday: Risk 0.5-1% of capital per trade
Swing Trades: Risk 1-2% of capital per trade
Max Portfolio Heat: 4-5% across all positions
Key Risk Levels
Invalidation Point (Bulls): Daily close below 46,100
Invalidation Point (Bears): Daily close above 47,300
Correlation Monitoring
Watch US10Y yields (inverse correlation currently strong)
S&P 500 and Nasdaq leading/lagging analysis
Dollar Index impact on risk appetite
MARKET CONTEXT & EXTERNAL FACTORS
Macroeconomic Considerations
Federal Reserve policy stance remains influential
Q3 earnings season beginning - watch corporate guidance
Geopolitical tensions requiring monitoring (Middle East, US-China)
Sentiment Indicators
VIX below 15 suggests complacency - potential volatility spike risk
Put/Call ratios showing neutral sentiment
Institutional flows appear distributive near highs
Seasonal Patterns
October historically volatile (correction risk)
Year-end rally potential if correction occurs early month
FINAL TRADING RECOMMENDATIONS
For Intraday Traders:
Best Setup: Wait for pullback to 46,650-46,700 for low-risk long entries
Avoid: Chasing above 46,900 without confirmation
Focus Timeframes: 15-minute and 1-hour charts for entries; 5-minute for exits
For Swing Traders:
Patience Required: Current levels are extended; wait for 46,300-46,500 zone
Alternative: Small position at current levels with very tight stops (46,650)
Best Risk/Reward: Appears in the 46,300-46,400 region
Overall Market Outlook:
Bullish bias maintained with 60-65% probability of testing 47,200+ in coming 2-3 weeks. However, near-term consolidation or shallow pullback (5-7%) is healthy and would provide better entry opportunities. The combination of weakening momentum indicators and potential Gann time reversal window suggests patience will be rewarded.
TRADING PSYCHOLOGY NOTES
FOMO Warning: Resist urge to chase at current elevated levels
Discipline: Stick to predefined entry zones even if price continues higher
Flexibility: Be ready to flip bias if key levels break (46,100 bears / 47,300 bulls)
Disclaimer: This analysis is for educational purposes only. Trading involves substantial risk of loss. Always conduct your own research and consult with financial advisors before making investment decisions. Past performance does not guarantee future results.
Next Update: October 7, 2025 (Mid-week review with refined levels)
Analysis combines multiple technical methodologies for comprehensive market perspective. No single indicator should be used in isolation. Confluence of signals increases probability of success.
EXECUTIVE SUMMARY
The Dow Jones Industrial Average is trading at 46,785.30, showing consolidation near all-time highs. Multi-timeframe analysis reveals a bullish trend with caution signals emerging on shorter timeframes. Key resistance at 47,000-47,200 zone presents a critical decision point for continuation versus correction.
Bottom Line: Bullish bias remains intact on daily/weekly charts, but intraday traders should watch for potential pullback to 46,500-46,300 support zone before next leg higher.
MULTI-TIMEFRAME MARKET STRUCTURE
Monthly/Weekly Context (Swing Trading)
Trend: Strong bullish momentum maintained since October 2023 lows
Elliott Wave Count: Potential Wave 5 of larger degree impulse, suggesting final push before correction
Key Levels: Major support at 45,800-46,000 (previous breakout zone); resistance at 47,200-47,500
Daily Chart Analysis
Structure: Higher highs and higher lows pattern intact
Ichimoku Cloud: Price trading above bullish cloud; Tenkan-sen/Kijun-sen bullish cross active
Pattern Recognition: Ascending channel formation with upper boundary at 47,150
4-Hour Chart (Critical Timeframe)
Candlestick Patterns: Recent doji and spinning tops indicating indecision
RSI: Divergence warning - price making higher highs while RSI shows lower highs (bearish divergence)
Volume Profile: Declining volume on recent push higher suggests weakening momentum
1-Hour/30-Minute (Intraday Focus)
Microstructure: Double top formation developing at 46,850-46,900 zone
Bollinger Bands: Price touching upper band with band width expanding
VWAP: Trading 0.2% above daily VWAP (46,692) - moderately extended
TECHNICAL INDICATOR DEEP DIVE
Momentum Indicators
RSI (14):
Daily: 62 (neutral-bullish)
4H: 58 (declining from 72 two days ago)
1H: 54 (bearish divergence present)
Interpretation: Momentum cooling after recent rally; not yet oversold
Trend Indicators
Moving Averages:
20 EMA: 46,580 (immediate support)
50 EMA: 46,200 (critical support)
200 EMA: 44,800 (long-term trend support)
Golden Cross Status: Active and bullish (50 MA above 200 MA)
Volatility Indicators
Bollinger Bands (20,2): Price at upper band; squeeze releasing suggests increased volatility ahead
ATR (14): 285 points (elevated) - expect 250-350 point daily ranges
Volume Analysis
Volume Weighted Average Price: 46,692
Volume Trend: Declining on up-moves (distribution warning)
Anchored VWAP: From October 1st low at 46,450 - price 0.7% above anchor
HARMONIC & PATTERN ANALYSIS
Gann Analysis
Square of 9: Next resistance at 47,088 (90° from current cycle low); support at 46,488
Gann Angles: 1x1 angle from September low projects support at 46,550
Time Cycles: October 8-10 represents potential reversal window (45-48 trading days from last pivot)
Harmonic Patterns
Potential Bat Pattern: Monitoring for completion at 46,950-47,000 (0.886 retracement level)
Fibonacci Confluence: 1.618 extension of recent corrective wave targets 47,150
Wyckoff Analysis
Phase: Appears to be in Distribution Phase B (preliminary supply)
Spring/Shakeout Watch: False breakout above 47,000 could trigger sell-off
Elliott Wave Count
Primary Count: Wave 5 of Intermediate (3), targeting 47,400-47,800
Alternate Count: Wave B corrective triangle forming; expect breakdown if 46,500 breaks
SUPPORT & RESISTANCE FRAMEWORK
Immediate Resistance Zones
46,850-46,900 - Intraday double top / psychological
47,000-47,050 - Major psychological / round number / Gann level
47,150-47,200 - Channel top / Fibonacci 1.618 / weekly pivot
47,500-47,600 - All-time high extension target
Support Zones
46,650-46,700 - VWAP / hourly demand zone
46,500-46,550 - 20 EMA / Gann 1x1 angle / pivot
46,200-46,300 - 50 EMA / gap fill / strong demand
45,800-46,000 - Daily cloud / major breakout point
TRAP SCENARIOS
Bull Trap Alert
Setup: Break above 47,000 with low volume followed by immediate reversal
Confirmation: Close below 46,800 same day with volume spike
Target: Retest 46,300-46,500 zone
Bear Trap Potential
Setup: Quick spike below 46,500 followed by rapid recovery
Confirmation: Close above 46,650 with strong volume
Target: Resume rally toward 47,200+
INTRADAY TRADING PLAN (October 4-11, 2025)
Day Trading Strategy - Scalp Setups
Bullish Scenario (60% Probability)
Entry Criteria:
Pullback to 46,650-46,700 with bullish engulfing or hammer on 15M chart
RSI (15M) reaches 40-45 oversold region
Volume contraction during pullback, expansion on reversal
Trade Setup:
Entry: 46,680-46,720
Stop Loss: 46,580 (100 points risk)
Target 1: 46,850 (130 points, 1.3:1 R/R) - scale out 50%
Target 2: 47,000 (280 points, 2.8:1 R/R) - scale out 30%
Target 3: 47,150 (430 points, 4.3:1 R/R) - let 20% run
Optimal Entry Times:
9:45-10:15 AM EST (post-opening volatility)
2:00-3:00 PM EST (afternoon momentum)
Bearish Scenario (40% Probability)
Entry Criteria:
Rejection at 46,900-47,000 with bearish engulfing on 15M/30M
RSI (15M) overbought above 70
Break below 46,780 (short-term support)
Trade Setup:
Entry: 46,760-46,800 (after break confirmation)
Stop Loss: 46,920 (120-160 points risk)
Target 1: 46,650 (110-150 points) - cover 50%
Target 2: 46,500 (260-300 points) - cover 30%
Target 3: 46,300 (460-500 points) - trail remainder
Optimal Entry Times:
10:30-11:00 AM EST (if morning rally fails)
3:00-3:45 PM EST (late-day profit taking)
SWING TRADING PLAN (1-4 Week Horizon)
Primary Swing Setup - Bullish Continuation
Entry Strategy:
Ideal Entry Zone: 46,300-46,500 (if pullback materializes)
Aggressive Entry: Current levels with 46,450 stop
Pattern: Bull flag/ascending channel continuation
Position Management:
Entry: 46,400 (scale in 30% at 46,500, 40% at 46,400, 30% at 46,300 if available)
Stop Loss: 46,100 (300 points, daily close below)
Target 1: 47,200 (700-800 points) - reduce 40%
Target 2: 47,800 (1,300-1,400 points) - reduce 30%
Target 3: 48,500 (2,000+ points) - trail with 50 EMA
Timeframe: 2-4 weeks
Confidence Level: 65%
Alternative Swing Setup - Mean Reversion Short
Activation Criteria:
Daily close below 46,500 with volume above 20-day average
RSI daily breaks below 50
Break of ascending trendline from September
Trade Setup:
Entry: 46,450-46,500 (after confirmation)
Stop Loss: 46,850 (350-400 points)
Target 1: 46,000 (450-500 points) - cover 50%
Target 2: 45,600 (850-900 points) - cover 30%
Target 3: 45,200 (1,250-1,300 points) - trail remainder
Timeframe: 1-3 weeks
Confidence Level: 35% (lower probability setup)
WEEKLY ROADMAP (October 4-11)
Monday-Tuesday (Oct 6-7):
Expected Range: 46,500-47,100
Bias: Neutral to bullish - watch for pullback completion
Key Level: 46,700 (holding above maintains bullish structure)
Wednesday-Thursday (Oct 8-9):
Gann Time Window: Potential reversal period
Strategy: Reduce position size; let patterns develop
Watch: Economic data releases could spike volatility
Friday (Oct 10):
Weekly Close: Critical for swing positioning
Bullish Confirmation: Close above 46,850
Bearish Warning: Close below 46,600
RISK MANAGEMENT GUIDELINES
Position Sizing
Intraday: Risk 0.5-1% of capital per trade
Swing Trades: Risk 1-2% of capital per trade
Max Portfolio Heat: 4-5% across all positions
Key Risk Levels
Invalidation Point (Bulls): Daily close below 46,100
Invalidation Point (Bears): Daily close above 47,300
Correlation Monitoring
Watch US10Y yields (inverse correlation currently strong)
S&P 500 and Nasdaq leading/lagging analysis
Dollar Index impact on risk appetite
MARKET CONTEXT & EXTERNAL FACTORS
Macroeconomic Considerations
Federal Reserve policy stance remains influential
Q3 earnings season beginning - watch corporate guidance
Geopolitical tensions requiring monitoring (Middle East, US-China)
Sentiment Indicators
VIX below 15 suggests complacency - potential volatility spike risk
Put/Call ratios showing neutral sentiment
Institutional flows appear distributive near highs
Seasonal Patterns
October historically volatile (correction risk)
Year-end rally potential if correction occurs early month
FINAL TRADING RECOMMENDATIONS
For Intraday Traders:
Best Setup: Wait for pullback to 46,650-46,700 for low-risk long entries
Avoid: Chasing above 46,900 without confirmation
Focus Timeframes: 15-minute and 1-hour charts for entries; 5-minute for exits
For Swing Traders:
Patience Required: Current levels are extended; wait for 46,300-46,500 zone
Alternative: Small position at current levels with very tight stops (46,650)
Best Risk/Reward: Appears in the 46,300-46,400 region
Overall Market Outlook:
Bullish bias maintained with 60-65% probability of testing 47,200+ in coming 2-3 weeks. However, near-term consolidation or shallow pullback (5-7%) is healthy and would provide better entry opportunities. The combination of weakening momentum indicators and potential Gann time reversal window suggests patience will be rewarded.
TRADING PSYCHOLOGY NOTES
FOMO Warning: Resist urge to chase at current elevated levels
Discipline: Stick to predefined entry zones even if price continues higher
Flexibility: Be ready to flip bias if key levels break (46,100 bears / 47,300 bulls)
Disclaimer: This analysis is for educational purposes only. Trading involves substantial risk of loss. Always conduct your own research and consult with financial advisors before making investment decisions. Past performance does not guarantee future results.
Next Update: October 7, 2025 (Mid-week review with refined levels)
Analysis combines multiple technical methodologies for comprehensive market perspective. No single indicator should be used in isolation. Confluence of signals increases probability of success.
I am nothing @shunya.trade
Thông báo miễn trừ trách nhiệm
Thông tin và ấn phẩm không có nghĩa là và không cấu thành, tài chính, đầu tư, kinh doanh, hoặc các loại lời khuyên hoặc khuyến nghị khác được cung cấp hoặc xác nhận bởi TradingView. Đọc thêm trong Điều khoản sử dụng.
I am nothing @shunya.trade
Thông báo miễn trừ trách nhiệm
Thông tin và ấn phẩm không có nghĩa là và không cấu thành, tài chính, đầu tư, kinh doanh, hoặc các loại lời khuyên hoặc khuyến nghị khác được cung cấp hoặc xác nhận bởi TradingView. Đọc thêm trong Điều khoản sử dụng.