USDT Dominance Weekly Chart Analysis
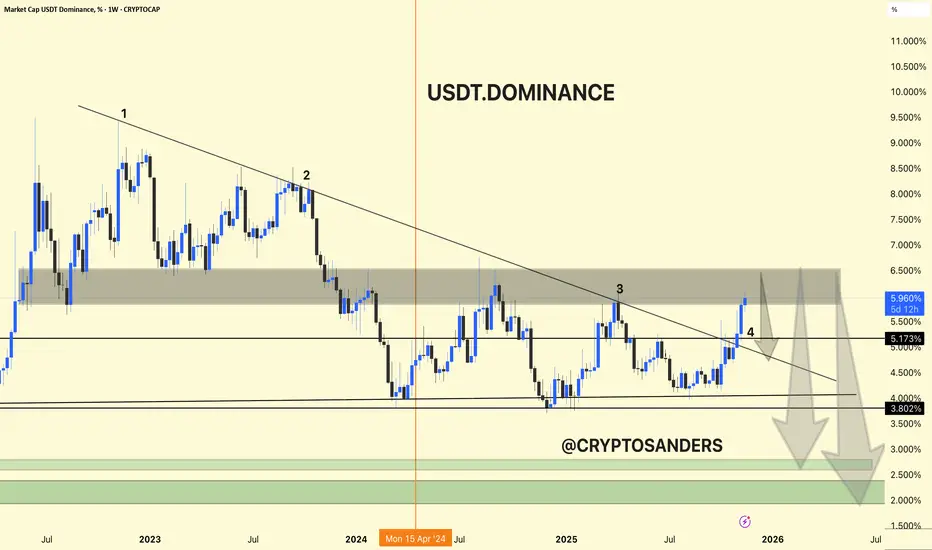
USDT dominance has been in a wide downtrend since mid-2022, repeatedly making lower highs along a major descending trendline.
Resistance Test: The dominance index is currently retesting the upper boundary of a key supply zone (5.5–6.2%), where it has previously faced sharp rejections (marked 1, 2, 3, 4).
Breakout Risk: Despite the latest rally, the price shows potential for another rejection at this supply zone, with the trendline acting as resistance.
Downside Projections: If rejected, USDT dominance may head for significant support near 4.0% and then 3.8%, with further targets at the green accumulation zone around 2.5–3.0%. This would suggest capital rotation out of stablecoins and back into crypto assets.
USDT dominance is at a major resistance, historically rejecting this trendline and zone. Another rejection here could mean reduced market fear and capital flowing back into riskier crypto assets. A sustained breakout above 6.2% would signal increased stablecoin preference and ongoing risk aversion.
DYOR | NFA
Bài đăng liên quan
Thông báo miễn trừ trách nhiệm
Thông tin và các ấn phẩm này không nhằm mục đích, và không cấu thành, lời khuyên hoặc khuyến nghị về tài chính, đầu tư, giao dịch hay các loại khác do TradingView cung cấp hoặc xác nhận. Đọc thêm tại Điều khoản Sử dụng.
Bài đăng liên quan
Thông báo miễn trừ trách nhiệm
Thông tin và các ấn phẩm này không nhằm mục đích, và không cấu thành, lời khuyên hoặc khuyến nghị về tài chính, đầu tư, giao dịch hay các loại khác do TradingView cung cấp hoặc xác nhận. Đọc thêm tại Điều khoản Sử dụng.