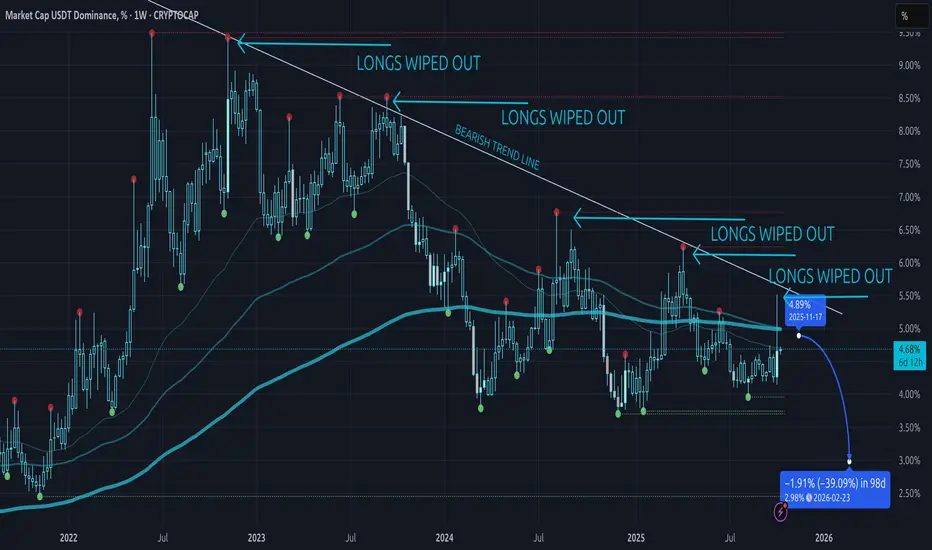
Quick take: the weekly downtrend in USDT dominance is intact. We keep respecting the same descending trendline that starts at the Nov 7, 2022 peak, then tags Sep 11, 2023 → Aug 5, 2024 → Apr 7, 2025 → Oct 6, 2025. Every touch has printed a lower high. Price is still below the weekly 200 EMA (see the thick cyan line on the chart), which keeps the high-timeframe bias pointed down for USDT.D—and by extension, up for BTC/ETH/altcoins, because USDT.D typically moves inversely to the crypto market.
The part that matters to me is how liquidity spikes on USDT.D have behaved. On Aug 5, 2024, we swept the prior highs and then bled lower for roughly ~168 days, about ~45% down from that spike. On Apr 7, 2025, same story: a sharp markup and then a ~36% markdown after the sweep. Today we’ve done it again—another wick into the trendline, another lower high, and we’re still trading under the 200-week EMA. That combo has consistently led to multi-week declines in dominance.
Short term, after last Friday’s deleveraging and thin books, I’m not pretending to know every intraday zigzag. But on daily/weekly, the picture hasn’t changed: we cleaned the prior highs, failed at the trendline, and are sitting around the mid-4% zone with momentum fading under the EMAs. My base case is chop under the line and then a push lower toward the ~3% area (marked on the chart). If that plays out, it’s exactly the sort of backdrop that’s fueled alt rallies in the past as stablecoins rotate into risk.
What would make me reconsider? A meaningful refill of the wick and acceptance back toward ~5.5% with a weekly close above the trendline and the 200 EMA. Until I see that, I’m treating last week as a de-leveraging spike before higher for crypto broadly, not the end of the cycle. I’ll be watching the next 30 days: hold under the line and roll over, and I like the odds we slide toward 3%—which, historically, has lined up with strong legs up in BTC, ETH, and the better alts.
The part that matters to me is how liquidity spikes on
Short term, after last Friday’s deleveraging and thin books, I’m not pretending to know every intraday zigzag. But on daily/weekly, the picture hasn’t changed: we cleaned the prior highs, failed at the trendline, and are sitting around the mid-4% zone with momentum fading under the EMAs. My base case is chop under the line and then a push lower toward the ~3% area (marked on the chart). If that plays out, it’s exactly the sort of backdrop that’s fueled alt rallies in the past as stablecoins rotate into risk.
What would make me reconsider? A meaningful refill of the wick and acceptance back toward ~5.5% with a weekly close above the trendline and the 200 EMA. Until I see that, I’m treating last week as a de-leveraging spike before higher for crypto broadly, not the end of the cycle. I’ll be watching the next 30 days: hold under the line and roll over, and I like the odds we slide toward 3%—which, historically, has lined up with strong legs up in BTC, ETH, and the better alts.
Thông báo miễn trừ trách nhiệm
Thông tin và ấn phẩm không có nghĩa là và không cấu thành, tài chính, đầu tư, kinh doanh, hoặc các loại lời khuyên hoặc khuyến nghị khác được cung cấp hoặc xác nhận bởi TradingView. Đọc thêm trong Điều khoản sử dụng.
Thông báo miễn trừ trách nhiệm
Thông tin và ấn phẩm không có nghĩa là và không cấu thành, tài chính, đầu tư, kinh doanh, hoặc các loại lời khuyên hoặc khuyến nghị khác được cung cấp hoặc xác nhận bởi TradingView. Đọc thêm trong Điều khoản sử dụng.