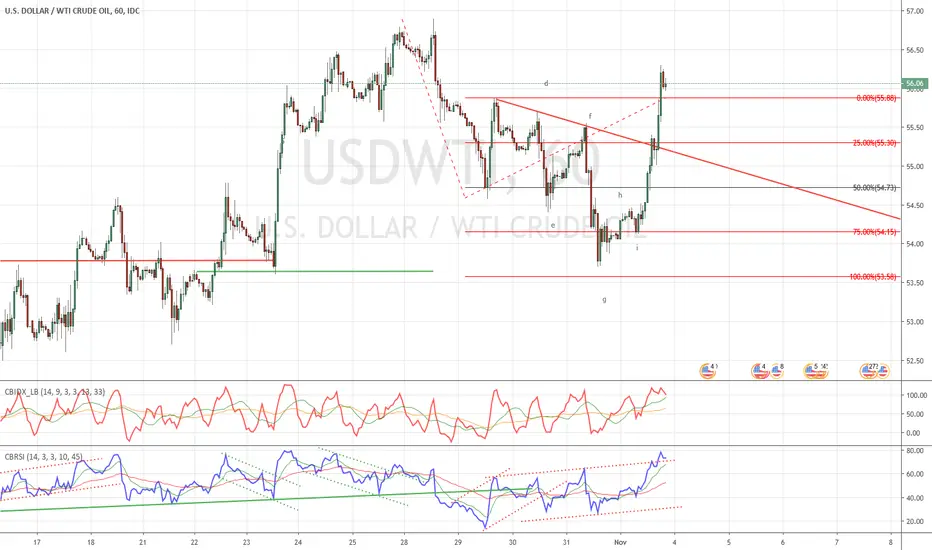
Yesterday the price action of WTI made a promising bullish setup.
First of all the bearish trend on the hourly chart, which started on October 28th, ended a few cents above the projected price range of $53,58.
Since then a strong opposite bullish price reaction has unfolded which broke many resistances.
Furthermore, the RSI broke out of a descending channel (negative reversal) and reached the 80 area, strengthening the bullish outlook of WTI.
Before getting long you should wait for a price pullback. This will give you the opportunity to calculate the price projections.
Thông báo miễn trừ trách nhiệm
Thông tin và ấn phẩm không có nghĩa là và không cấu thành, tài chính, đầu tư, kinh doanh, hoặc các loại lời khuyên hoặc khuyến nghị khác được cung cấp hoặc xác nhận bởi TradingView. Đọc thêm trong Điều khoản sử dụng.
Thông báo miễn trừ trách nhiệm
Thông tin và ấn phẩm không có nghĩa là và không cấu thành, tài chính, đầu tư, kinh doanh, hoặc các loại lời khuyên hoặc khuyến nghị khác được cung cấp hoặc xác nhận bởi TradingView. Đọc thêm trong Điều khoản sử dụng.