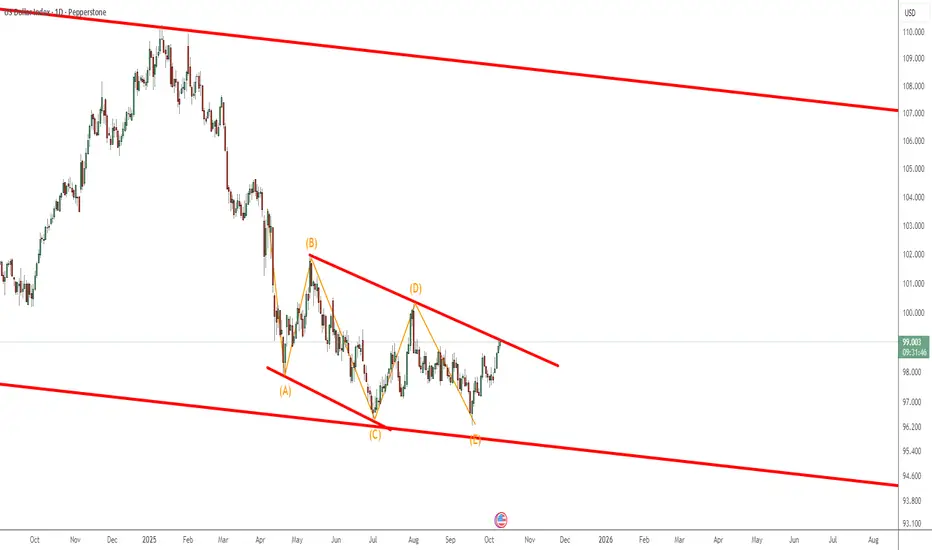
The DXY is currently testing the upper boundary of a well-defined ending diagonal pattern on the daily timeframe — a structure that often appears at the end of a corrective phase, signaling the beginning of a new impulsive move.
After months of consolidation inside the narrowing wedge, momentum is now turning upward, suggesting a potential bullish breakout is underway. This diagonal likely marks the final wave of a corrective decline (Wave 5 of C) — meaning a larger bullish cycle could be ready to unfold.
Key Technical Notes:
🔹 Price is challenging the upper diagonal resistance near 99.00–99.40.
🔹 A confirmed daily close above this zone would invalidate the bearish wedge and trigger a trend reversal signal.
🔹 Next upside targets: 101.00, 103.50, and potentially 107.00 in extension.
🔹 Pullbacks toward 97.50–98.00 may offer buy-the-dip opportunities within the breakout structure.
Wave Context:
This move could represent the early stages of a new impulse (Wave 1 or Wave A) following the completion of an ending diagonal — a classic reversal signal in Elliott Wave theory.
Momentum Outlook:
Bullish divergence and a tightening structure suggest sellers are exhausted. A confirmed breakout would likely ignite short covering and renewed USD strength across the board.
Bias: ✅ Bullish / Long-biased — watching for breakout confirmation above 99.40.
Thông báo miễn trừ trách nhiệm
Thông tin và ấn phẩm không có nghĩa là và không cấu thành, tài chính, đầu tư, kinh doanh, hoặc các loại lời khuyên hoặc khuyến nghị khác được cung cấp hoặc xác nhận bởi TradingView. Đọc thêm trong Điều khoản sử dụng.
Thông báo miễn trừ trách nhiệm
Thông tin và ấn phẩm không có nghĩa là và không cấu thành, tài chính, đầu tư, kinh doanh, hoặc các loại lời khuyên hoặc khuyến nghị khác được cung cấp hoặc xác nhận bởi TradingView. Đọc thêm trong Điều khoản sử dụng.