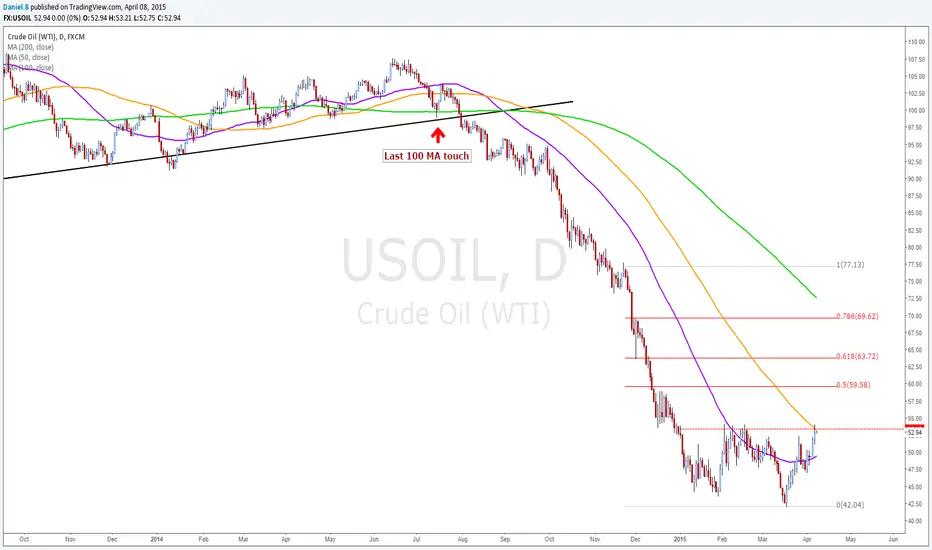
Well, as we all may of noticed by now, WTI crude is now testing this years highs, and a break above would mean that I look for more convenient buying opportunities. But the main point of this chart is to point out the numerous breakouts above the 50MA and more importantly the testing of the Daily 100MA resistance. Which is something we haven't seen since July of last year. There are many fundamental factors at play here, but I find it to time consuming to put a full on research report on T.V. lol. Anyhow, also marked on the chart are some resistance levels to keep in mind in the case of a break above.
Thông báo miễn trừ trách nhiệm
Thông tin và ấn phẩm không có nghĩa là và không cấu thành, tài chính, đầu tư, kinh doanh, hoặc các loại lời khuyên hoặc khuyến nghị khác được cung cấp hoặc xác nhận bởi TradingView. Đọc thêm trong Điều khoản sử dụng.
Thông báo miễn trừ trách nhiệm
Thông tin và ấn phẩm không có nghĩa là và không cấu thành, tài chính, đầu tư, kinh doanh, hoặc các loại lời khuyên hoặc khuyến nghị khác được cung cấp hoặc xác nhận bởi TradingView. Đọc thêm trong Điều khoản sử dụng.