This idea is backed by my general view that the stock market is going to crash in August. what this means is that we are going into a risk-off environment and there will be reduced consumption and demand for oil too.
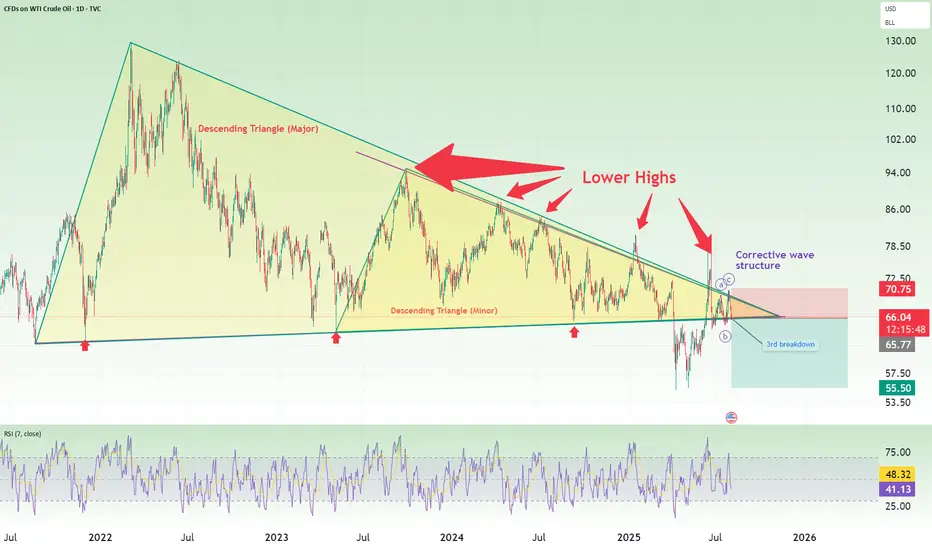
Technically, I pointed out 4 things in this chart:
1. Descending triangles
2. Lower highs
3. 3rd breakdown (after a false break to the upside)
4. A corrective wave structure
Good luck!
Technically, I pointed out 4 things in this chart:
1. Descending triangles
2. Lower highs
3. 3rd breakdown (after a false break to the upside)
4. A corrective wave structure
Good luck!
Bài đăng liên quan
Thông báo miễn trừ trách nhiệm
The information and publications are not meant to be, and do not constitute, financial, investment, trading, or other types of advice or recommendations supplied or endorsed by TradingView. Read more in the Terms of Use.
Bài đăng liên quan
Thông báo miễn trừ trách nhiệm
The information and publications are not meant to be, and do not constitute, financial, investment, trading, or other types of advice or recommendations supplied or endorsed by TradingView. Read more in the Terms of Use.