Elite Analysis
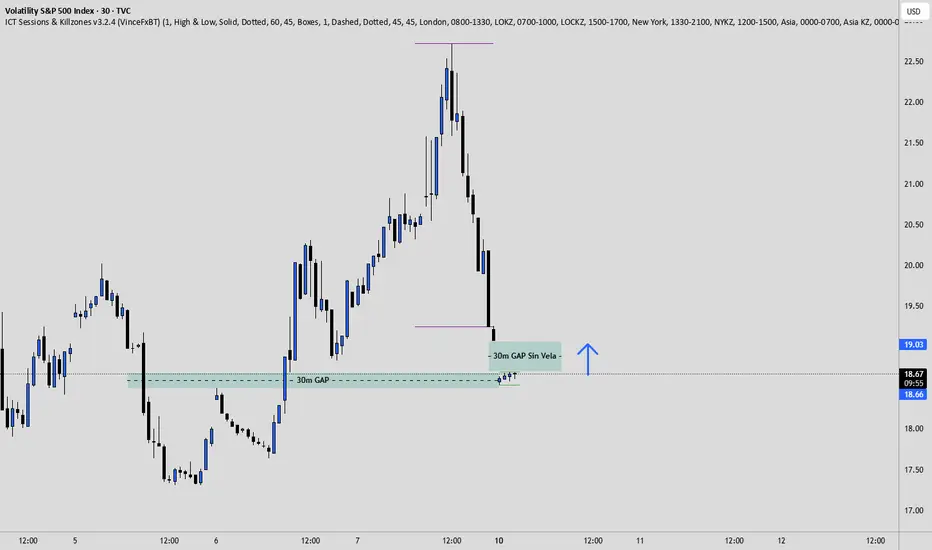
Chart Context: VIX 30m
Price just tapped into a 30-minute gap (FVG) and reacted cleanly.
That gap (marked in green) is acting as a demand zone for volatility.
Each time the VIX bounces from a demand/FVG zone like this → volatility increases → equities (SPX, NASDAQ, US30) tend to drop.
----
Interpretation
VIX bouncing = Risk sentiment worsening.
This means fear/volatility is entering the market, often triggering sell-offs in indices.
Your NASDAQ short position aligns perfectly with this — the probability of a continuation down increases as the VIX reverses upward.
So, if VIX holds above 18.60 and expands toward 19.50–20.00, expect NASDAQ and S&P to drop into their next liquidity zones (25,300–25,000 area you mapped earlier).
----
VIX has reached a 30m imbalance and is starting to rebound. Rising volatility usually means selling pressure on NASDAQ and SPX.
If the VIX continues above 18.60, it supports our short bias on NAS100 toward 25,300–25,000.
📊 Educational purpose — not financial advice.
Jonathan Leal - The Elite Trading
Thông báo miễn trừ trách nhiệm
Thông tin và ấn phẩm không có nghĩa là và không cấu thành, tài chính, đầu tư, kinh doanh, hoặc các loại lời khuyên hoặc khuyến nghị khác được cung cấp hoặc xác nhận bởi TradingView. Đọc thêm trong Điều khoản sử dụng.
Jonathan Leal - The Elite Trading
Thông báo miễn trừ trách nhiệm
Thông tin và ấn phẩm không có nghĩa là và không cấu thành, tài chính, đầu tư, kinh doanh, hoặc các loại lời khuyên hoặc khuyến nghị khác được cung cấp hoặc xác nhận bởi TradingView. Đọc thêm trong Điều khoản sử dụng.