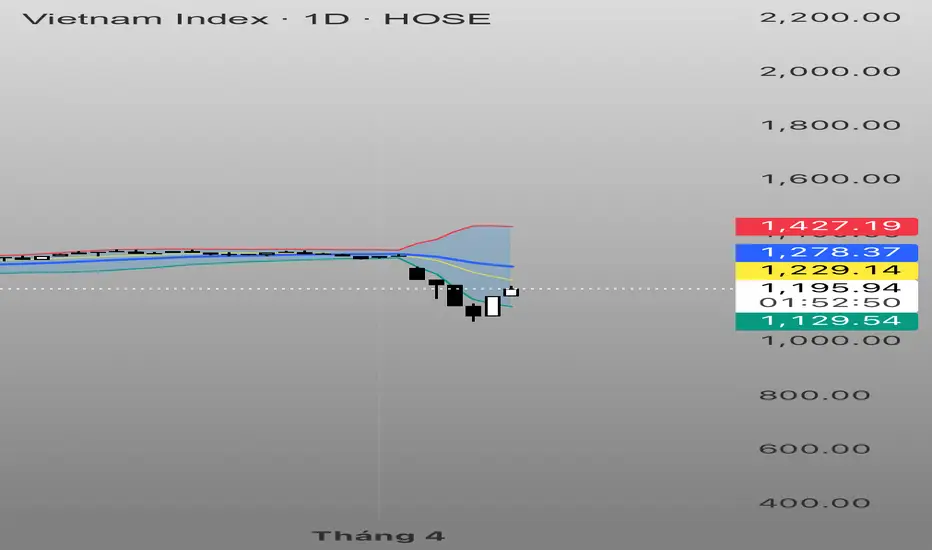
//version=5
strategy("XAUUSD M15 Bollinger + ATR Strategy", overlay=true, margin_long=100, margin_short=100)
// --- Input Parameters ---
var float bb_length = input.int(20, "Bollinger Bands Length", minval=1)
var float bb_mult = input.float(2.0, "Bollinger Bands Multiplier", minval=0.1, step=0.1)
var float atr_length = input.int(14, "ATR Length", minval=1)
var float lot_size = input.float(0.1, "Lot Size", minval=0.01, step=0.01)
// --- Indicators ---
[float sma, float upper, float lower] = ta.bb(close, bb_length, bb_mult)
float atr = ta.atr(atr_length)
// --- Trading Logic ---
var float entry_price = 0.0
var float sl_price = 0.0
var float tp_price = 0.0
// Buy Condition: Close above Upper Band
if (ta.crossover(close, upper))
entry_price := close
sl_price := close - atr
tp_price := close + atr
strategy.entry("Buy", strategy.long, qty=lot_size)
strategy.exit("Exit Buy", "Buy", stop=sl_price, limit=tp_price)
// Sell Condition: Close below Lower Band
if (ta.crossunder(close, lower))
entry_price := close
sl_price := close + atr
tp_price := close - atr
strategy.entry("Sell", strategy.short, qty=lot_size)
strategy.exit("Exit Sell", "Sell", stop=sl_price, limit=tp_price)
// --- Plot Bollinger Bands and ATR ---
plot(sma, "SMA", color=color.blue)
plot(upper, "Upper Band", color=color.red)
plot(lower, "Lower Band", color=color.green)
plot(atr, "ATR", color=color.purple, style=plot.style_histogram, display=display.bottom)
// --- Performance Statistics ---
var table stats_table = table.new(position.top_right, 5, 7, border_width=1)
if (barstate.islastconfirmed)
table.cell(stats_table, 0, 0, "Metric", text_color=color.white, bgcolor=color.gray)
table.cell(stats_table, 0, 1, "Total Trades", text_color=color.white, bgcolor=color.gray)
table.cell(stats_table, 0, 2, "Win Rate (%)", text_color=color.white, bgcolor=color.gray)
table.cell(stats_table, 0, 3, "Net Profit", text_color=color.white, bgcolor=color.gray)
table.cell(stats_table, 0, 4, "Profit Factor", text_color=color.white, bgcolor=color.gray)
table.cell(stats_table, 0, 5, "Max Drawdown", text_color=color.white, bgcolor=color.gray)
table.cell(stats_table, 0, 6, "Avg Trade", text_color=color.white, bgcolor=color.gray)
table.cell(stats_table, 1, 0, "Value", text_color=color.white, bgcolor=color.black)
table.cell(stats_table, 1, 1, str.tostring(strategy.closedtrades), text_color=color.white, bgcolor=color.black)
table.cell(stats_table, 1, 2, str.tostring(math.round(strategy.winners / math.max(strategy.closedtrades, 1) * 100, 2)), text_color=color.white, bgcolor=color.black)
table.cell(stats_table, 1, 3, str.tostring(math.round(strategy.netprofit, 2)), text_color=color.white, bgcolor=color.black)
table.cell(stats_table, 1, 4, str.tostring(math.round(strategy.grossprofit / math.max(strategy.grossloss, 1), 2)), text_color=color.white, bgcolor=color.black)
table.cell(stats_table, 1, 5, str.tostring(math.round(strategy.max_drawdown, 2)), text_color=color.white, bgcolor=color.black)
table.cell(stats_table, 1, 6, str.tostring(math.round(strategy.netprofit / math.max(strategy.closedtrades, 1), 2)), text_color=color.white, bgcolor=color.black)
// --- Plot Entry/Exit Signals ---
plotshape(ta.crossover(close, upper), "Buy Signal", style=shape.triangleup, location=location.belowbar, color=color.green, size=size.small)
plotshape(ta.crossunder(close, lower), "Sell Signal", style=shape.triangledown, location=location.abovebar, color=color.red, size=size.small)
Thông báo miễn trừ trách nhiệm
Thông tin và ấn phẩm không có nghĩa là và không cấu thành, tài chính, đầu tư, kinh doanh, hoặc các loại lời khuyên hoặc khuyến nghị khác được cung cấp hoặc xác nhận bởi TradingView. Đọc thêm trong Điều khoản sử dụng.
Thông báo miễn trừ trách nhiệm
Thông tin và ấn phẩm không có nghĩa là và không cấu thành, tài chính, đầu tư, kinh doanh, hoặc các loại lời khuyên hoặc khuyến nghị khác được cung cấp hoặc xác nhận bởi TradingView. Đọc thêm trong Điều khoản sử dụng.
