After weeks of compressed price action and relentless seller pressure, WAL is showing signs of a potential explosive move. Is this the breakout bulls have been waiting for?
🧩 Chart Pattern: Descending Triangle — With a Bullish Twist
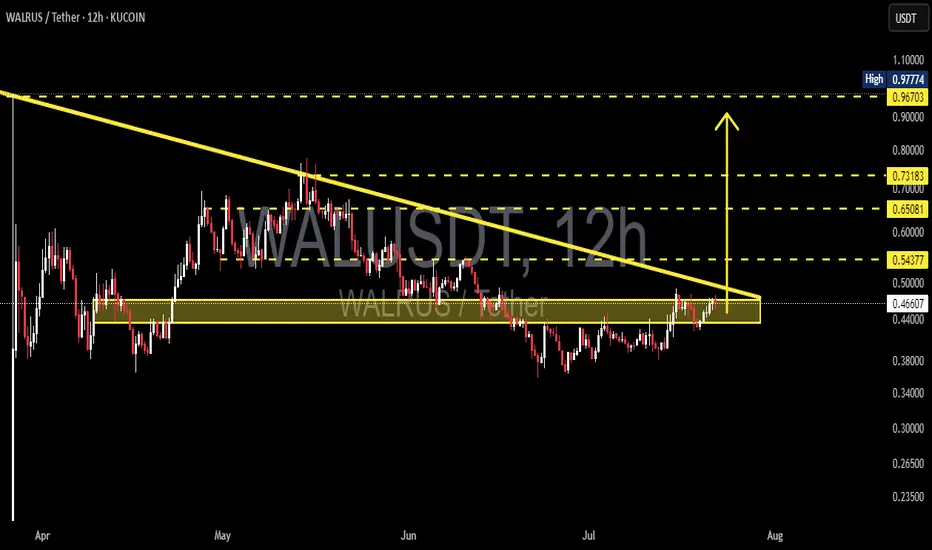
Over the past 3 months, WAL has formed a descending triangle, typically known as a bearish continuation pattern.
But here’s the twist — WAL is breaking out upwards, signaling potential trend reversal instead.
The pattern shows higher lows meeting a horizontal resistance around $0.47–$0.48, a classic sign that buyers are gaining strength.
This setup suggests buyers are slowly overpowering the selling pressure, leading to a high-probability breakout scenario.
🟡 Strong Accumulation Zone: $0.42–$0.45
This range has consistently acted as a strong support base since mid-April.
Every dip into this zone has been met with strong buyback and increasing volume.
It likely represents a smart money accumulation zone before a larger markup phase.
🚀 Breakout Target: Where Could Price Go?
Measured move from the triangle's height projects a move of ~$0.25. From the breakout level at ~$0.48, this gives a technical target around $0.73.
🎯 Bullish Price Targets:
1. TP1: $0.543 — First breakout validation zone
2. TP2: $0.650 — Previous May resistance level
3. TP3: $0.731 — Measured move target from triangle
4. Extended Target: $0.967 – $0.977 — Prior liquidity and local high zone
With sustained volume, $1.00+ isn’t off the table.
---
🔻 Bearish Scenario:
If this breakout turns into a fakeout:
Price may revisit the support zone at $0.45–$0.42.
Breakdown below this zone opens risk toward:
🧨 $0.36 — Mid-range demand zone
Further breakdown could lead to $0.30–$0.28
Confirmation of a fakeout: A strong 12H close below the yellow box support with increasing sell volume.
🔍 Additional Bullish Confirmation Signals:
Volume should spike significantly above average to validate breakout.
RSI, MACD, or EMA crossover can help strengthen the bullish thesis if aligned.
✅ Summary
WAL/USDT is currently at a pivotal breakout moment. A confirmed move above the descending triangle could trigger a major trend reversal, with targets between $0.65 and $0.73 in sight. This setup could be one of the cleanest breakout opportunities on the charts right now.
#WALUSDT #CryptoBreakout #TechnicalAnalysis #BullishSetup #DescendingTriangle #AltcoinWatch
🧩 Chart Pattern: Descending Triangle — With a Bullish Twist
Over the past 3 months, WAL has formed a descending triangle, typically known as a bearish continuation pattern.
But here’s the twist — WAL is breaking out upwards, signaling potential trend reversal instead.
The pattern shows higher lows meeting a horizontal resistance around $0.47–$0.48, a classic sign that buyers are gaining strength.
This setup suggests buyers are slowly overpowering the selling pressure, leading to a high-probability breakout scenario.
🟡 Strong Accumulation Zone: $0.42–$0.45
This range has consistently acted as a strong support base since mid-April.
Every dip into this zone has been met with strong buyback and increasing volume.
It likely represents a smart money accumulation zone before a larger markup phase.
🚀 Breakout Target: Where Could Price Go?
Measured move from the triangle's height projects a move of ~$0.25. From the breakout level at ~$0.48, this gives a technical target around $0.73.
🎯 Bullish Price Targets:
1. TP1: $0.543 — First breakout validation zone
2. TP2: $0.650 — Previous May resistance level
3. TP3: $0.731 — Measured move target from triangle
4. Extended Target: $0.967 – $0.977 — Prior liquidity and local high zone
With sustained volume, $1.00+ isn’t off the table.
---
🔻 Bearish Scenario:
If this breakout turns into a fakeout:
Price may revisit the support zone at $0.45–$0.42.
Breakdown below this zone opens risk toward:
🧨 $0.36 — Mid-range demand zone
Further breakdown could lead to $0.30–$0.28
Confirmation of a fakeout: A strong 12H close below the yellow box support with increasing sell volume.
🔍 Additional Bullish Confirmation Signals:
Volume should spike significantly above average to validate breakout.
RSI, MACD, or EMA crossover can help strengthen the bullish thesis if aligned.
✅ Summary
WAL/USDT is currently at a pivotal breakout moment. A confirmed move above the descending triangle could trigger a major trend reversal, with targets between $0.65 and $0.73 in sight. This setup could be one of the cleanest breakout opportunities on the charts right now.
#WALUSDT #CryptoBreakout #TechnicalAnalysis #BullishSetup #DescendingTriangle #AltcoinWatch
✅ Get Free Signals! Join Our Telegram Channel Here: t.me/TheCryptoNuclear
✅ Twitter: twitter.com/crypto_nuclear
✅ Join Bybit : partner.bybit.com/b/nuclearvip
✅ Benefits : Lifetime Trading Fee Discount -50%
✅ Twitter: twitter.com/crypto_nuclear
✅ Join Bybit : partner.bybit.com/b/nuclearvip
✅ Benefits : Lifetime Trading Fee Discount -50%
Thông báo miễn trừ trách nhiệm
Thông tin và các ấn phẩm này không nhằm mục đích, và không cấu thành, lời khuyên hoặc khuyến nghị về tài chính, đầu tư, giao dịch hay các loại khác do TradingView cung cấp hoặc xác nhận. Đọc thêm tại Điều khoản Sử dụng.