A lot has happened since the last chart was published. Past 2 weeks has reshaped the pattern.
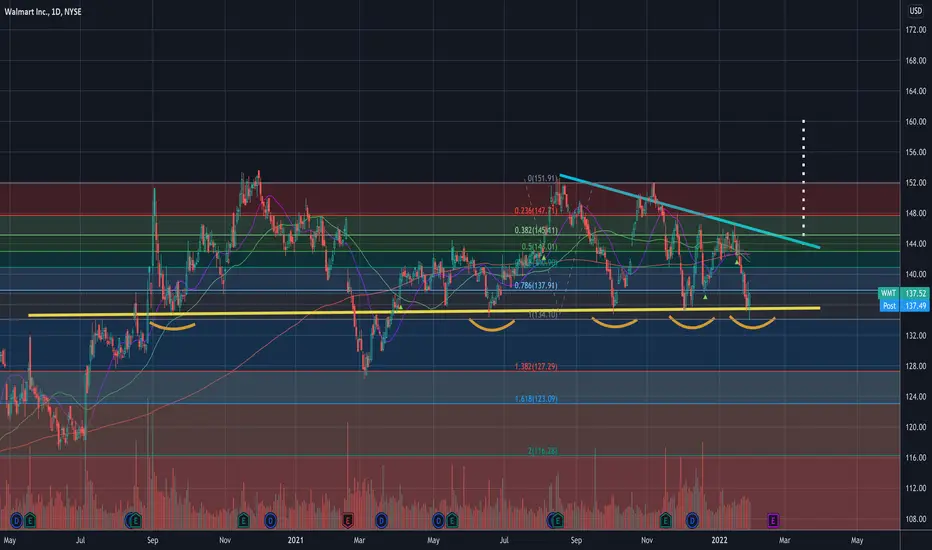
The price is currently sitting on lower trend line of a descending wedge at around $135 area. $135 has provided as support prior 3 times and it provided support again in today's trading session.
It may be a signal that reversal could be happening and the price could again travel towards the upper trend line area of around $144.
If the price breaks above $146, we can expect the price to travel to $151 which is prior all time high. If the momentum allows, we can see $160.
Anything is possible in this volatile market. If the price breaks below $135 support, we can expect to see $127.29.
Bullish Target 1 - $144
Bullish Target 2 - $151
Bearish Target - $127.29 (If the price breaks below $135 support.)
———————————————————
How to read my charts?
- Matching color trend lines shows the pattern. Sometimes a chart can have multiple patterns. Each pattern will have matching color trend lines.
- The yellow horizontal lines shows support and resistance areas.
- Fib lines also shows support and resistance areas.
- The dotted white lines shows price projection for breakout or breakdown target.
Disclaimer: Do your own DD. Not an investment advice.
I am not a licensed professional. None of the posts that I published are investment advice. Do your own research.
Thông báo miễn trừ trách nhiệm
Thông tin và ấn phẩm không có nghĩa là và không cấu thành, tài chính, đầu tư, kinh doanh, hoặc các loại lời khuyên hoặc khuyến nghị khác được cung cấp hoặc xác nhận bởi TradingView. Đọc thêm trong Điều khoản sử dụng.