Gold (29.4.2014) traded lower once again & reach to $1268 mark, however some fundamental issues made it little more volatile on charts.
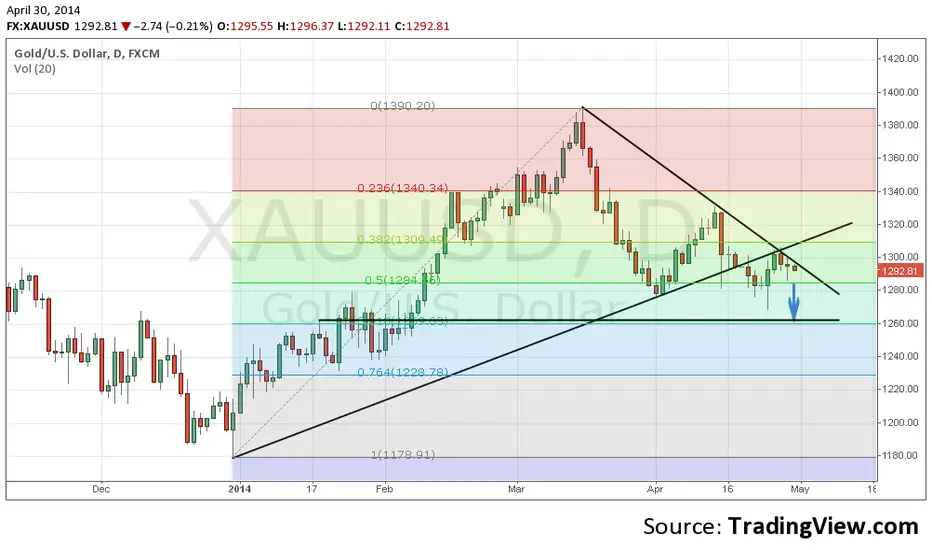
Now gold is trading below $1300 once again & as we can see on charts, gold kissed the broken trade line which was unable to hold prices up 3rd time in mid april. The upside reversal we witness in gold in last 2 times is making a pattern of lower high, lower lows which indicate for further weakness ahead. At the same a black cloud cover candle just below the broken trade line hinting for another downside move. Although the last 2 downside move was little away from the full target around $1262, indicators still trading in negative mode.
On fundamental side the tong war between US & RUSSIA has come to a pause with monday US sanction which was seems to be very less effective compare to market expectation. Meanwhile FOMC meeting in coming 2 days will divert the traders concentration towards long term goal rather an small one.
Based on above studies, we will prefer to sell gold for some possible target around $1262 & then may be more. Only a day close above $1312 will reject the forecast.
MCX june resistance area : 28910 - 29070
MCX june support area : 28580 - 28300
Thông báo miễn trừ trách nhiệm
Thông tin và ấn phẩm không có nghĩa là và không cấu thành, tài chính, đầu tư, kinh doanh, hoặc các loại lời khuyên hoặc khuyến nghị khác được cung cấp hoặc xác nhận bởi TradingView. Đọc thêm trong Điều khoản sử dụng.
Thông báo miễn trừ trách nhiệm
Thông tin và ấn phẩm không có nghĩa là và không cấu thành, tài chính, đầu tư, kinh doanh, hoặc các loại lời khuyên hoặc khuyến nghị khác được cung cấp hoặc xác nhận bởi TradingView. Đọc thêm trong Điều khoản sử dụng.