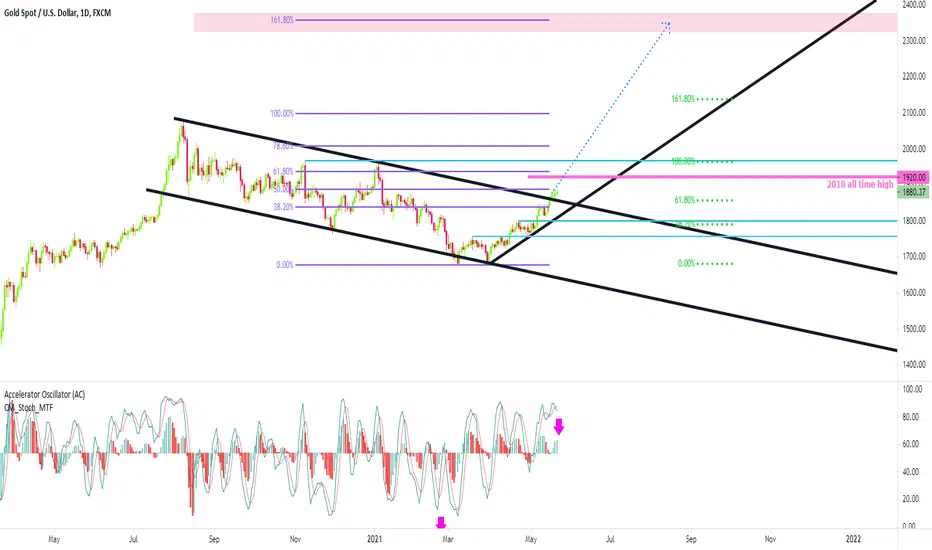
look to chart , if you see AC (or stoch 7.4.4) full green,going to red true?, this will move gold down in next 10 day (if buyer pressure be high (+trend), price can zigzag ,range this week) until AC daily go down,full of red bar,you can buy gold and hold it until AC go up ,full green,3-4 green bar in up (close signal)
if buyer pressure on news go up and gold can break high 1890-1900 , above normal scenario (normal move) will cancel and gold can fly up(breakup)
note=AC created by Bill williams is like stochastic movment , it need min 3 month monitor reaction ,practice on demo + 100% need SL
pick Accelerator Oscillator (AC) indicator for trading view

secret= on gold , silver (i think on forex too,but not sure) AC on 1hour + daily chart is important
on dax index FDAX1! , nasdaq,dow AC on 30min+4hour chart is important,ok? (on dax my stratgy is with AC 30-240min ,in 10 pos i eat 4sl 6tp , my tp =3*sl)
for trade gold AC and SMA 200(simple movin avrage) on 1hour and daily chart is enough (and draw important support+trendlines),DONT USE INDICATORS GIVE YOU REVERSE SIGNAL like bollinger bond, RSI ,,,, gold is VERY VERY TRENDY ,when go up ,will go up more like cow ( not zigzag like dax )
for metatrader4
4xone.com/acceleratoroscillator_mtf-metatrader-indicator/
if buyer pressure on news go up and gold can break high 1890-1900 , above normal scenario (normal move) will cancel and gold can fly up(breakup)
note=AC created by Bill williams is like stochastic movment , it need min 3 month monitor reaction ,practice on demo + 100% need SL
pick Accelerator Oscillator (AC) indicator for trading view
secret= on gold , silver (i think on forex too,but not sure) AC on 1hour + daily chart is important
on dax index FDAX1! , nasdaq,dow AC on 30min+4hour chart is important,ok? (on dax my stratgy is with AC 30-240min ,in 10 pos i eat 4sl 6tp , my tp =3*sl)
for trade gold AC and SMA 200(simple movin avrage) on 1hour and daily chart is enough (and draw important support+trendlines),DONT USE INDICATORS GIVE YOU REVERSE SIGNAL like bollinger bond, RSI ,,,, gold is VERY VERY TRENDY ,when go up ,will go up more like cow ( not zigzag like dax )
for metatrader4
4xone.com/acceleratoroscillator_mtf-metatrader-indicator/
Thông báo miễn trừ trách nhiệm
Thông tin và các ấn phẩm này không nhằm mục đích, và không cấu thành, lời khuyên hoặc khuyến nghị về tài chính, đầu tư, giao dịch hay các loại khác do TradingView cung cấp hoặc xác nhận. Đọc thêm tại Điều khoản Sử dụng.
Thông báo miễn trừ trách nhiệm
Thông tin và các ấn phẩm này không nhằm mục đích, và không cấu thành, lời khuyên hoặc khuyến nghị về tài chính, đầu tư, giao dịch hay các loại khác do TradingView cung cấp hoặc xác nhận. Đọc thêm tại Điều khoản Sử dụng.