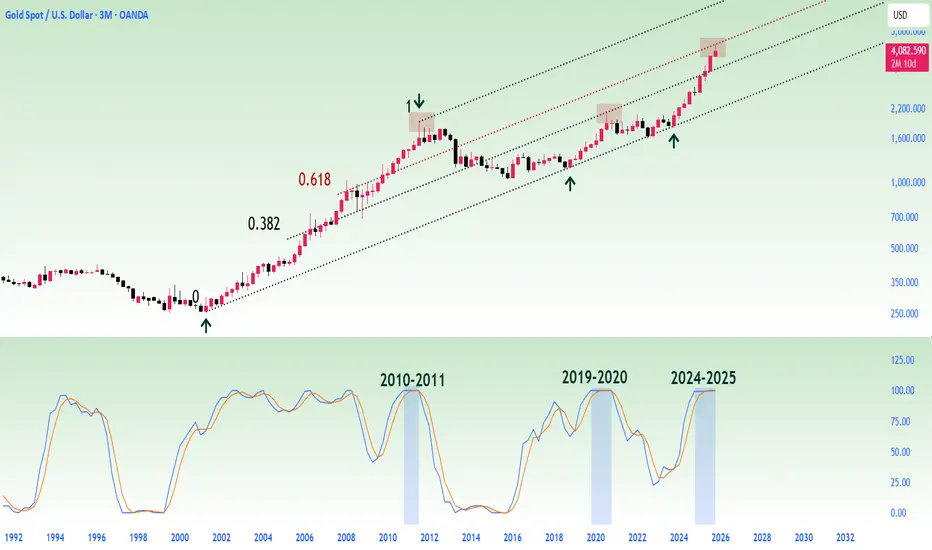
Gold has been rejected at the 0.618 level of the Fibonacci channel on the 3M chart.
The Stoch RSI demonstrates a striking similarity to past cycles:
The bullish structure, which continued in the overbought region in October 2010, peaked 273 days later in July 2011.
Momentum, which continued in the overbought region again in October 2019, reached its peak 365 days later in October 2020.
Today, history paints a similar picture once again.
The bullish structure, which began in the overbought region in October 2024, may have reached its peak approximately one year later, in October 2025, just as in previous cycles.
Gold appears to be completing its historical rhythm once again.
Thông báo miễn trừ trách nhiệm
Thông tin và ấn phẩm không có nghĩa là và không cấu thành, tài chính, đầu tư, kinh doanh, hoặc các loại lời khuyên hoặc khuyến nghị khác được cung cấp hoặc xác nhận bởi TradingView. Đọc thêm trong Điều khoản sử dụng.
Thông báo miễn trừ trách nhiệm
Thông tin và ấn phẩm không có nghĩa là và không cấu thành, tài chính, đầu tư, kinh doanh, hoặc các loại lời khuyên hoặc khuyến nghị khác được cung cấp hoặc xác nhận bởi TradingView. Đọc thêm trong Điều khoản sử dụng.