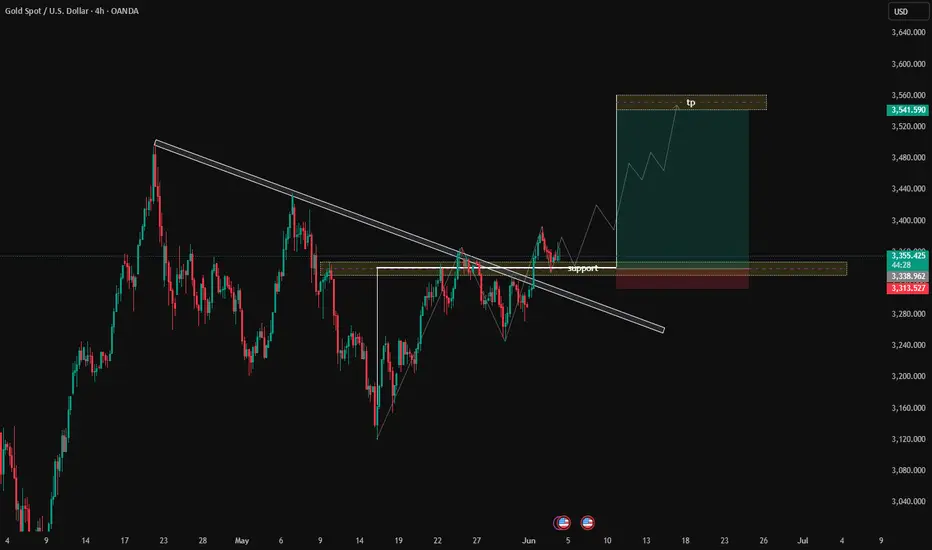
You’ve drawn a descending trendline from previous highs that’s been broken recently. This suggests a potential shift from a downtrend to an uptrend, indicating bullish momentum.
Support Zone Identified:
You marked a horizontal support zone around 3,320–3,340 USD (approx.). Price has retested this support zone after the breakout, showing it is now acting as a new support.
Bullish Continuation Plan:
From the support zone, you’ve drawn a potential bullish move with higher highs and higher lows, indicating a bullish market structure.
The projected move targets a take profit (TP) level around 3,560 USD, marked on the chart. This aligns with a previous swing high or a key resistance level.
Entry Strategy:
Price has already broken above the downtrend line and is consolidating around the new support zone. This suggests a buy trade opportunity from the support zone aiming for the TP level.
Risk Management:
Although you didn’t mark a stop-loss level explicitly, traders would normally place it below the support zone, maybe around 3,280 USD, to manage risk in case the breakout fails.
Summary in English:
You analyzed the 4-hour Gold chart and identified a descending trendline that has been broken, signaling a potential shift to an uptrend. The price has retested a key horizontal support zone around 3,320–3,340 USD. From this support zone, you expect the price to move upward in a series of higher highs and higher lows, eventually reaching the take profit zone around 3,560 USD. This analysis suggests a buy trade setup from the support zone with a target at 3,560 USD.
Simple Explanation:
A downtrend line was broken, showing bullish strength.
Price is now retesting the new support zone.
A bullish move is expected from this support zone, aiming for a higher target.
The trade idea is to buy from support and take profit at the higher target.
Thông báo miễn trừ trách nhiệm
Thông tin và ấn phẩm không có nghĩa là và không cấu thành, tài chính, đầu tư, kinh doanh, hoặc các loại lời khuyên hoặc khuyến nghị khác được cung cấp hoặc xác nhận bởi TradingView. Đọc thêm trong Điều khoản sử dụng.
Thông báo miễn trừ trách nhiệm
Thông tin và ấn phẩm không có nghĩa là và không cấu thành, tài chính, đầu tư, kinh doanh, hoặc các loại lời khuyên hoặc khuyến nghị khác được cung cấp hoặc xác nhận bởi TradingView. Đọc thêm trong Điều khoản sử dụng.