Hello traders,
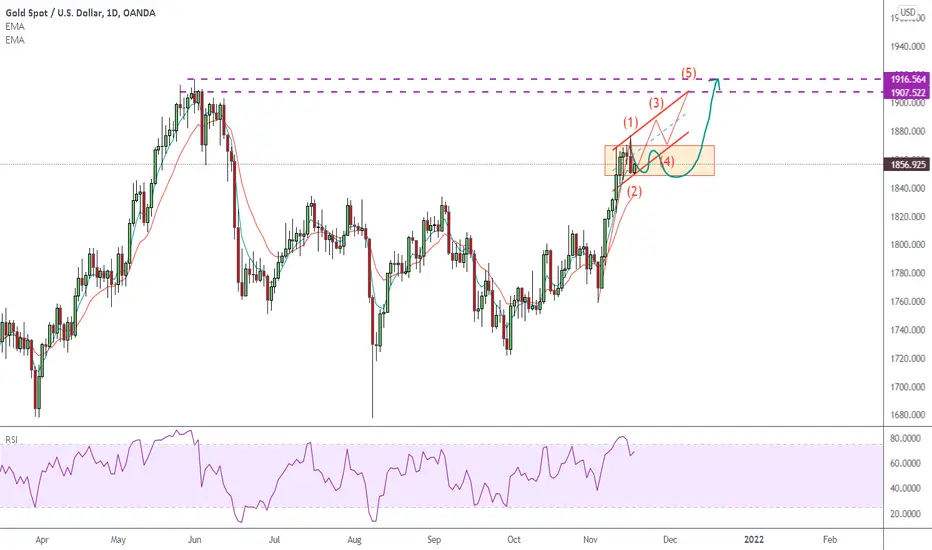
GOLD is facing two ways to reach 1900-1911 zone on daily chart.
It would go sideways inside the red rectangle to consolidate before new leg up to test new high.
Or
it would continue to rise in a rough way insidw a flat red channel till it hit the 1900-1911 zone.
Both ways would need you to setup in a lower timeframe chart .
The correction idea in my last idea is not valid anymore with new price action.
RISK LOWER THAN YOUR TOLERANCE:
Suggested Risk <5%
Your Real Entry Position Will Make Different RR for Your Trade.
GOOD LUCK!!!
LESS IS MORE!
Đóng lệnh: dừng lỗ
Join Free Telegram Group to get MORE trading skills: t.me/FuntraderVera
Bài đăng liên quan
Thông báo miễn trừ trách nhiệm
Thông tin và ấn phẩm không có nghĩa là và không cấu thành, tài chính, đầu tư, kinh doanh, hoặc các loại lời khuyên hoặc khuyến nghị khác được cung cấp hoặc xác nhận bởi TradingView. Đọc thêm trong Điều khoản sử dụng.