Big Breakout:
Trading Levels
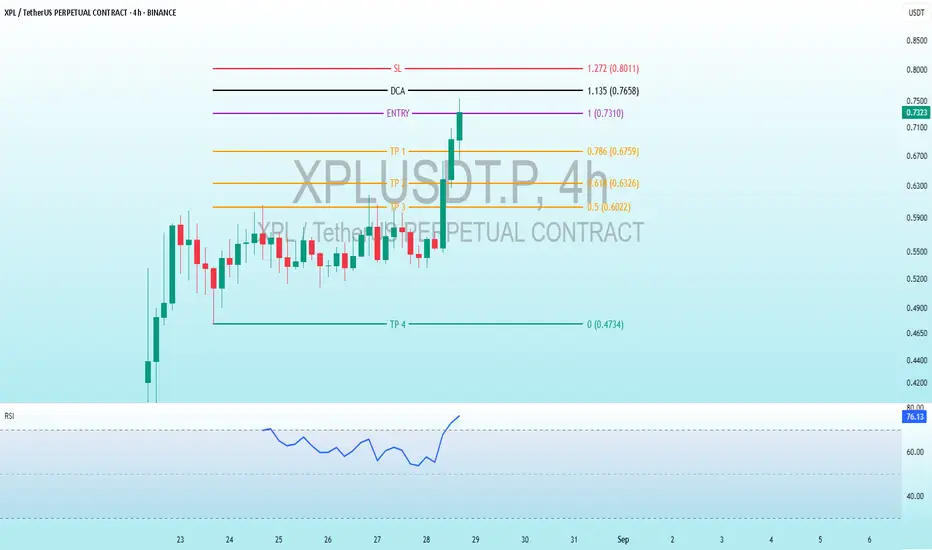
The chart indicates predefined levels for a trading strategy:
Entry: 0.7310 - 0.7330 USD - The point where the trader plans to enter the market.
SL (Stop Loss): 1.272 USD (0.8011) - A level to close the position at a loss, which seems high and might be a typographical error (could be 0.1272 or 0.7127, but clarification is needed).
TP (Take Profit): Four exit levels for profit:TP1: 0.786 USD (0.6759)
TP2: 0.618 USD (0.6326)
TP3: 0.5 USD (0.6022)
TP4: 0.4734 USD
DCA (Dollar Cost Averaging): 1.135 USD (0.7658) - A level for cost averaging, possibly for additional purchases if the price drops.
Price Analysis
The price has experienced a sharp decline earlier, reaching a low of around 0.47 USD, before recovering to the entry level (0.7310).
The current movement appears bullish, with a steady rise after a consolidation period, but the high RSI suggests a potential pullback or correction soon.
Interpretation
Strategy: The chart suggests a moderately risky strategy with good profit potential. The TP levels are set with a relatively balanced risk-reward ratio, but the high SL (1.272) seems unusual and might be an error.
RSI: The value of 77 - 76 indicates a condition nearing overbought, which may signal a pullback or correction toward levels like TP1 or TP2.
Trend: There are signs of a short-term bullish trend, but the proximity to overbought conditions might lead to consolidation or a slight decline.
✅MY Free Signals Telegram
t.me/AltcoinPiooners
✅Personal Telegram (Premium)
t.me/Altcoin_Piooners
✅YouTube
youtube.com/@AltcoinPiooners
t.me/AltcoinPiooners
✅Personal Telegram (Premium)
t.me/Altcoin_Piooners
✅YouTube
youtube.com/@AltcoinPiooners
Thông báo miễn trừ trách nhiệm
Thông tin và ấn phẩm không có nghĩa là và không cấu thành, tài chính, đầu tư, kinh doanh, hoặc các loại lời khuyên hoặc khuyến nghị khác được cung cấp hoặc xác nhận bởi TradingView. Đọc thêm trong Điều khoản sử dụng.