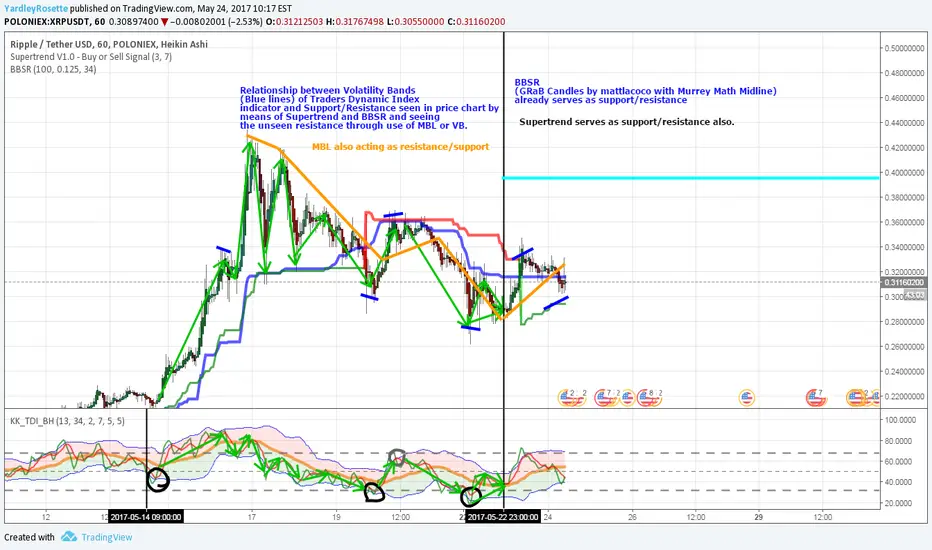
Chart presented shows behavior of lines related to price chart for better use (& understanding) of Traders Dynamic Index for whoever really cares about profiting.
Volatility Bands relate to the price chart showing price resistance or support at the moment.
Market BaseLine may show itself to be support or resistance.
Supertrend & BBSR serve as price chart indication of support or resistance.
RSI/TSI (Green/Red) cross at 32 or 50 while or after, or near crossing into VB lines serves as a powerful/advantageous entry depending also on a bit more of price chart analysis.
Ghi chú
This is/was not a trade analysis.Thông báo miễn trừ trách nhiệm
Thông tin và ấn phẩm không có nghĩa là và không cấu thành, tài chính, đầu tư, kinh doanh, hoặc các loại lời khuyên hoặc khuyến nghị khác được cung cấp hoặc xác nhận bởi TradingView. Đọc thêm trong Điều khoản sử dụng.
Thông báo miễn trừ trách nhiệm
Thông tin và ấn phẩm không có nghĩa là và không cấu thành, tài chính, đầu tư, kinh doanh, hoặc các loại lời khuyên hoặc khuyến nghị khác được cung cấp hoặc xác nhận bởi TradingView. Đọc thêm trong Điều khoản sử dụng.