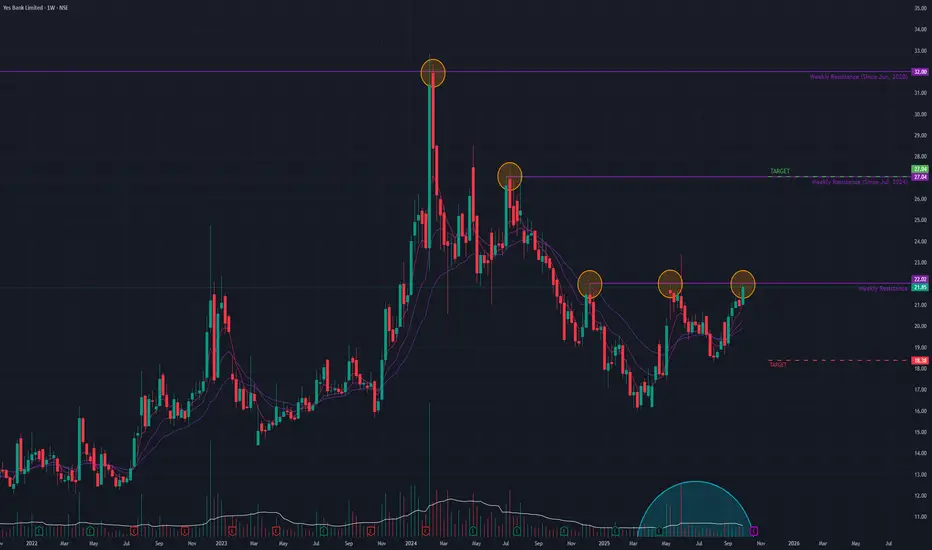
Yes Bank is showing signs of a potential trend reversal after being locked in a multi-year sideways consolidation since June 2020. Last week, the stock gained +4.2% on the back of a massive volume surge, indicating a significant increase in buyer interest.
The stock is now positioned directly below a critical horizontal resistance trendline. A decisive breakout above this level is required to confirm a shift from its long-term consolidation phase into a new uptrend.
Strong Long-Term Bullish Signals 👍
The potential for a reversal is supported by positive signals on higher timeframes:
- Monthly & Weekly Momentum: Short-term Exponential Moving Averages (EMAs) are in a bullish crossover state on both the monthly and weekly charts.
- Confirmed Strength: The Relative Strength Index (RSI) is also rising on both the monthly and weekly timeframes, confirming strong underlying momentum.
Outlook: A Breakout Awaits
The stock is at a crucial make-or-break point. While the long-term indicators are bullish, overcoming the overhead resistance is essential.
- Bullish Case 📈: If the current momentum is sustained and the stock achieves a decisive breakout, the next potential target is the ₹27 level.
- Bearish Case 📉: If the resistance holds and the momentum fades, the stock could pull back to find support near the ₹18 level.
Disclaimer: This analysis is my personal view & for educational purposes only. They shall not be construed as trade or investment advice. Before making any financial decision, it is imperative that you consult with a qualified financial professional.
Thông báo miễn trừ trách nhiệm
Thông tin và ấn phẩm không có nghĩa là và không cấu thành, tài chính, đầu tư, kinh doanh, hoặc các loại lời khuyên hoặc khuyến nghị khác được cung cấp hoặc xác nhận bởi TradingView. Đọc thêm trong Điều khoản sử dụng.