ZENTEC – Technical Outlook; CMP: ₹1467
Based on a comprehensive technical analysis of Zen Technologies Limited (ZENTEC), the stock is currently positioned at a critical juncture, with both Elliott Wave theory and the Bat Harmonic pattern indicating potential trading opportunities.
Elliott Wave Analysis
ZENTEC is trading at ₹1,467 as of October 2, 2025, down from its peak of ₹2,627 (Dec 2024).
The stock has retraced ~69% from its Wave 5 high, reflecting significant corrective pressure.
Price action suggests the stock is in Wave C of an ABC corrective pattern, following the completion of a five-wave impulse sequence.
Bat Harmonic Pattern
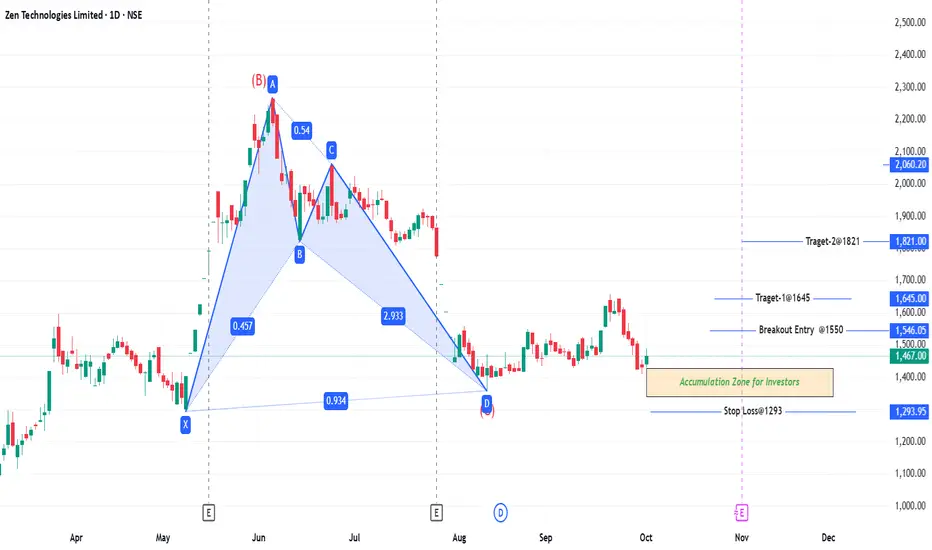
The Bat harmonic pattern is nearing completion with the following structure:
XA Leg: ₹1,293 → ₹2,266 (primary trend)
AB Retracement: 38.2%–50% of XA (completed)
BC Leg: Current position near ₹2,061
CD Target: 88.6% retracement at ₹1,357.06 (Potential Reversal Zone – PRZ)
This alignment suggests that the downside pressure is close to exhaustion, and bottoming out may be near.
Trading Strategy
Buy Zone (Long-Term Investors): ₹1,340 – ₹1,427
Stop Loss: ₹1,293
Aggressive Entry: On confirmed breakout above ₹1,550 (stop loss-1340)
Targets:
T1: ₹1,645
T2: ₹1,821
T3: ₹2,061
📌 Thanks a ton for checking out my idea! Hope it sparked some value for you.
🙏 Follow for more insights
👍 Boost if you found it helpful
✍️ Drop a comment with your thoughts below!
Based on a comprehensive technical analysis of Zen Technologies Limited (ZENTEC), the stock is currently positioned at a critical juncture, with both Elliott Wave theory and the Bat Harmonic pattern indicating potential trading opportunities.
Elliott Wave Analysis
ZENTEC is trading at ₹1,467 as of October 2, 2025, down from its peak of ₹2,627 (Dec 2024).
The stock has retraced ~69% from its Wave 5 high, reflecting significant corrective pressure.
Price action suggests the stock is in Wave C of an ABC corrective pattern, following the completion of a five-wave impulse sequence.
Bat Harmonic Pattern
The Bat harmonic pattern is nearing completion with the following structure:
XA Leg: ₹1,293 → ₹2,266 (primary trend)
AB Retracement: 38.2%–50% of XA (completed)
BC Leg: Current position near ₹2,061
CD Target: 88.6% retracement at ₹1,357.06 (Potential Reversal Zone – PRZ)
This alignment suggests that the downside pressure is close to exhaustion, and bottoming out may be near.
Trading Strategy
Buy Zone (Long-Term Investors): ₹1,340 – ₹1,427
Stop Loss: ₹1,293
Aggressive Entry: On confirmed breakout above ₹1,550 (stop loss-1340)
Targets:
T1: ₹1,645
T2: ₹1,821
T3: ₹2,061
📌 Thanks a ton for checking out my idea! Hope it sparked some value for you.
🙏 Follow for more insights
👍 Boost if you found it helpful
✍️ Drop a comment with your thoughts below!
Thông báo miễn trừ trách nhiệm
Thông tin và ấn phẩm không có nghĩa là và không cấu thành, tài chính, đầu tư, kinh doanh, hoặc các loại lời khuyên hoặc khuyến nghị khác được cung cấp hoặc xác nhận bởi TradingView. Đọc thêm trong Điều khoản sử dụng.
Thông báo miễn trừ trách nhiệm
Thông tin và ấn phẩm không có nghĩa là và không cấu thành, tài chính, đầu tư, kinh doanh, hoặc các loại lời khuyên hoặc khuyến nghị khác được cung cấp hoặc xác nhận bởi TradingView. Đọc thêm trong Điều khoản sử dụng.