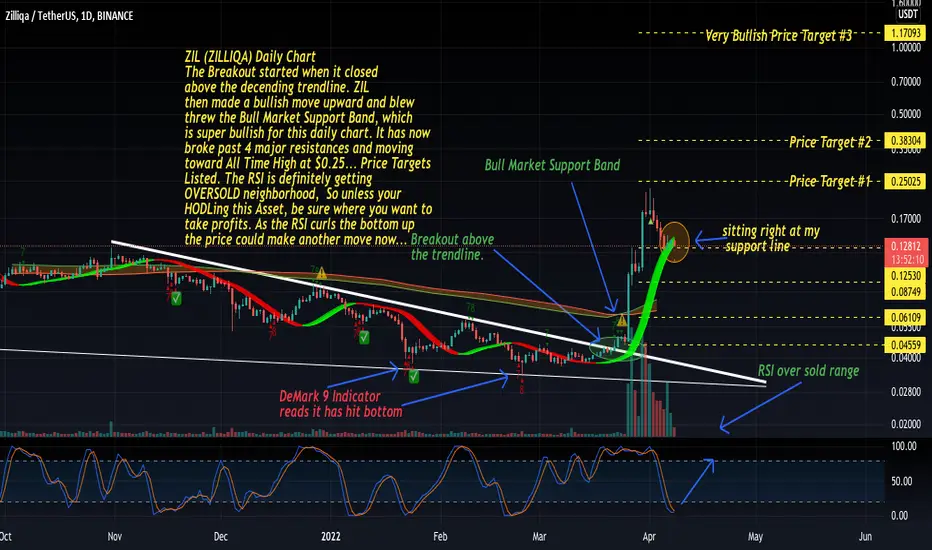
ZIL (ZILLIQA) Daily Chart
The Breakout started when it closed
above the decending trendline. ZIL
then made a bullish move upward and blew
threw the Bull Market Support Band, which
is super bullish for this daily chart. It has now
broke past 4 major resistances and moving
toward All Time High at $0.25... Price Targets
Listed. The RSI is definitely getting
OVERSOLD neighborhood, So unless your
HODLing this Asset, be sure where you want to
take profits. As the RSI curls the bottom up
the price could make another move now...
Thông báo miễn trừ trách nhiệm
Thông tin và ấn phẩm không có nghĩa là và không cấu thành, tài chính, đầu tư, kinh doanh, hoặc các loại lời khuyên hoặc khuyến nghị khác được cung cấp hoặc xác nhận bởi TradingView. Đọc thêm trong Điều khoản sử dụng.
Thông báo miễn trừ trách nhiệm
Thông tin và ấn phẩm không có nghĩa là và không cấu thành, tài chính, đầu tư, kinh doanh, hoặc các loại lời khuyên hoặc khuyến nghị khác được cung cấp hoặc xác nhận bởi TradingView. Đọc thêm trong Điều khoản sử dụng.