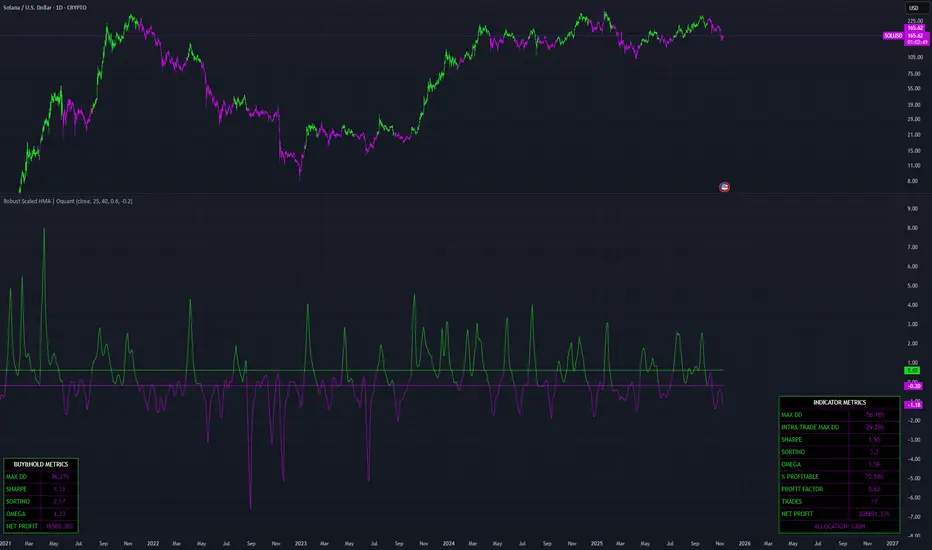
Robust Scaled HMA | Oquant
The Robust Scaled HMA indicator is a trend-following tool, leveraging a Hull Moving Average (HMA) with robust statistical scaling to generate buy and sell signals. It helps traders identify potential entry and exit points for long and short positions while providing comprehensive performance metrics to evaluate the strategy's effectiveness compared to a simple buy-and-hold approach(remember past performance doesn’t guarantee future results). By incorporating outlier-resistant scaling, it aims to deliver smoother, more adaptive signals in volatile markets. The indicator also visualizes allocation signals, equity curves, and key metrics in intuitive tables, empowering users to make data-driven decisions without relying on overly complex optimizations.
Key Factors/Components
Hull Moving Average (HMA): A fast and smooth moving average that reduces lag compared to traditional averages, serving as the core trend detector.
Robust Scaling Mechanism: Uses statistical measures like median and interquartile range (IQR) to normalize the HMA, making it resistant to extreme price outliers and potentially improving signal reliability in noisy markets.
Threshold-Based Signals: Customizable upper and lower thresholds to trigger long (bullish) or short (bearish) allocations, with options to enable/disable longs or shorts for strategy customization.
Performance Metrics Suite: Calculates performance metrics including Maximum Drawdown (Max DD), Intra-Trade Max DD, Sharpe Ratio, Sortino Ratio, Omega Ratio, Percent Profitable Trades, Profit Factor, Total Trades, and Net Profit.
Equity Curve and Visualization: Optional plotting of the strategy's equity curve, along with color-coded bars and candles for visual signal confirmation.
Comparative Analysis: Includes a buy-and-hold metrics table for benchmarking the indicator's performance against passive holding(remember past performance doesn’t guarantee future results).
Alert Conditions: Built-in alerts for bullish and bearish signals to notify users of potential trade opportunities.
How It Works
The indicator starts by applying a HMA to the selected price source to capture the underlying trend with minimal lag. This average is then scaled using robust statistical methods that focus on the central tendency and spread of recent data, filtering out the impact of extreme price swings for a more stable output. Signals are generated when the scaled value crosses predefined thresholds: exceeding the upper threshold indicates a potential long position (bullish momentum), while dropping below the lower threshold suggests a short position (bearish momentum). The system simulates a simple strategy by allocating to long, short, or cash based on user preferences, tracking returns over time from a specified start date. It then computes a range of performance metrics by analyzing the equity curve, drawdowns, and trade outcomes, presenting them alongside buy-and-hold equivalents for easy comparison(remember past performance doesn’t guarantee future results). This logic promotes trend-following while emphasizing risk management, without overcomplicating the process.
For Who Is Best/Recommended Use Cases
This indicator is best suited for traders focused on trend-following strategies in markets prone to volatility or outliers. Recommended use cases include: Trend Identification: As a filter for entering/exiting positions. Strategy Evaluation: Quickly assessing signal quality through integrated metrics without complex backtesting setups(Remember past performance doesn’t guarantee future results). Customization: Adjusting for bullish biases by disabling shorts, or vice versa, in one-sided markets.
Settings and Default Settings
The indicator offers flexible inputs grouped for ease of use:
Start Date: Defines the backtesting period (default: January 1, 2018) to ensure metrics are calculated from a relevant historical point.
Source: The price data input for calculations (default: close price).
HMA Length: Period for the Hull Moving Average (default: 25) – shorter values increase sensitivity, longer ones smooth out noise.
Robust Scaling Length: Window for statistical scaling (default: 40)
Upper Threshold: Level for triggering long signals (default: 0.6) – higher values make signals more conservative.
Lower Threshold: Level for triggering short signals (default: -0.2) – lower (more negative) values require stronger bearish confirmation.
Allow Long Trades: Enables long positions (default: true); if false, longs default to cash.
Allow Short Trades: Enables short positions (default: false); if false, shorts default to cash.
Show Indicator Metrics Table: Displays indicator performance table (default: true).
Show Buy&Hold Table: Displays benchmark metrics table (default: true).
Plot Equity Curve: Visualizes the strategy's cumulative returns (default: false).
Conclusion
The Robust Scaled HMA offers a fresh take on trend detection by prioritizing robustness through IQR scaling, making it a valuable addition for traders aiming to navigate noisy markets with metrics-backed insights(Remember past performance doesn’t guarantee future results).
⚠️ Disclaimer: This indicator is intended for educational and informational purposes only. Trading/investing involves risk, and past performance does not guarantee future results. Always test and evaluate indicators/strategies before applying them in live markets. Use at your own risk.
Tập lệnh chỉ hiển thị cho người được mời
Chỉ những người dùng được tác giả đồng ý mới có thể truy cập tập lệnh này. Bạn cần yêu cầu và xin phép sử dụng tập lệnh này. Quyền truy cập thường được cấp sau khi thanh toán. Để biết thêm chi tiết, hãy làm theo hướng dẫn của tác giả bên dưới hoặc liên hệ trực tiếp với oquant.
TradingView KHÔNG khuyến khích trả tiền hoặc sử dụng tập lệnh trừ khi bạn hoàn toàn tin tưởng tác giả và hiểu cách hoạt động của tập lệnh. Bạn cũng có thể tìm thấy các giải pháp thay thế miễn phí, mã nguồn mở trong mục tập lệnh cộng đồng của chúng tôi.
Hướng dẫn của tác giả
oquantsystems.com
Thông báo miễn trừ trách nhiệm
Tập lệnh chỉ hiển thị cho người được mời
Chỉ những người dùng được tác giả đồng ý mới có thể truy cập tập lệnh này. Bạn cần yêu cầu và xin phép sử dụng tập lệnh này. Quyền truy cập thường được cấp sau khi thanh toán. Để biết thêm chi tiết, hãy làm theo hướng dẫn của tác giả bên dưới hoặc liên hệ trực tiếp với oquant.
TradingView KHÔNG khuyến khích trả tiền hoặc sử dụng tập lệnh trừ khi bạn hoàn toàn tin tưởng tác giả và hiểu cách hoạt động của tập lệnh. Bạn cũng có thể tìm thấy các giải pháp thay thế miễn phí, mã nguồn mở trong mục tập lệnh cộng đồng của chúng tôi.
Hướng dẫn của tác giả
oquantsystems.com