Trade-o-Scope: Multi-Asset Price Tracker
"Multi-Asset Price Tracker" is designed to help analyze price changes across multiple assets within time intervals you define.
Motivation:
Most screeners on the market track price changes over predefined periods, like 1H\4H\12H\1D\3D\7D\etc. Typically, they compare initial and current prices.
But what if you want to analyze assets' performance over arbitrary historical intervals?
Perhaps you want to spot which assets dropped most within 7 hours after a specific industry announcement? Or do you want to check which asset grew the most in January last year?
This is where the "Multi-Asset Price Tracker" shines. It lets you define arbitrary intervals and track price changes for selected assets.
Overview and functionality:
- Define arbitrary time intervals in history for analyzing price changes.
- Create up to 10 lists, each with up to 40 symbols to track. Populate lists with data from text files, Excel, or CSV. Lists are just multiline text strings, each line representing an individual symbol.
- Switch between lists, with one active list at a time.
- Specify up to 3 fixed symbols for additional analysis alongside active list symbols. You may use them as reference points to compare price changes of the symbols in the List.
- Customize table appearance and position.
- Set sorting criteria and direction for displayed values.
- View the results in a table on the chart.
How it works:
"Multi-Asset Price Tracker" will track the symbol's price during the interval you define.
The indicator identifies each symbol's Start, Max, Min, and End prices during the interval. It then calculates relative changes: Start-to-Max, Start-to-Min, and Start-to-End.
The list of relative changes is ordered by the column chosen in settings and displayed on the chart.
List example (up to 10 Lists):
BINANCE:WLDUSDT.P
BINANCE:WOOUSDT.P
BINANCE:XEMUSDT.P
...
...
(up to 40 symbols per List)
Calculation example:
Symbol Start-price = $100
Symbol Max-price = $150
Symbol Min-price = $75
Symbol End-price = $110
Start-to-Max = 100% * (Max-price - Start-price) / Start-price = 100% * ($150 - $100) / $100 = 50%
Start-to-Min = 100% * (Min-price - Start-price) / Start-price = 100% * ($75 - $100) / $100 = -25%
Start-to-End = 100% * (End-price - Start-price) / Start-price = 100% * ($110 - $100) / $100 = 10%
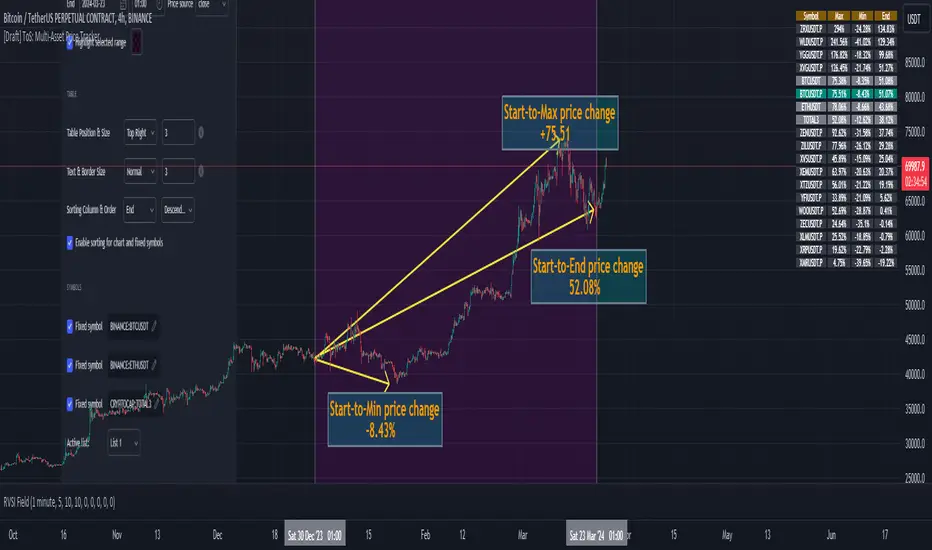
Chart example:
In the provided chart, you can observe an example with a table generated by the indicator, along with manually added arrows and labels explaining the calculation process for an individual symbol from the list.
How to use:
1) Add "Multi-Asset Price Tracker" indicator to the chart
2) The indicator will ask you to define the start and the end of the interval using the mouse on the chart.
Voila! You'll see the table with sorted relative price changes based on default list values and settings.
3) Customize the indicator's settings:
- Define the interval Start and End datetime.
- Optionally, change the interval Start and End by clicking on the indicator name and dragging the vertical mark at the edges of the interval to a new position.
- Define the Start and End price sources.
- Choose a color to highlight the interval on the chart's background.
- Set the table position, size, text size, and border size.
- Specify the column for sorting and its direction.
- Choose whether to sort chart symbols and fixed symbols together with list symbols or display them at the top of the table irrespective of their relative price change.
- Enable fixed symbols if needed, and define up to 3 fixed symbols.
- Define symbol lists, with up to 10 lists and 40 symbols each.
- Select which List to make active - symbols from the active list will be calculated and displayed.
Tập lệnh chỉ hiển thị cho người được mời
Chỉ những người dùng được tác giả chấp thuận mới có thể truy cập tập lệnh này. Bạn sẽ cần yêu cầu và được cấp quyền sử dụng. Thông thường quyền này được cấp sau khi thanh toán. Để biết thêm chi tiết, làm theo hướng dẫn của tác giả bên dưới hoặc liên hệ trực tiếp với Trade-o-Scope.
TradingView KHÔNG khuyến nghị bạn trả phí hoặc sử dụng một tập lệnh trừ khi bạn hoàn toàn tin tưởng vào tác giả và hiểu cách hoạt động của tập lệnh. Bạn cũng có thể tìm các lựa chọn miễn phí, mã nguồn mở trong các script cộng đồng của chúng tôi.
Hướng dẫn của tác giả
👉 Gain full access to our invite-only indicators through Patreon
patreon.com/tradeoscope
📺 Check our YouTube
youtube.com/@Trade-o-Scope
Thông báo miễn trừ trách nhiệm
Tập lệnh chỉ hiển thị cho người được mời
Chỉ những người dùng được tác giả chấp thuận mới có thể truy cập tập lệnh này. Bạn sẽ cần yêu cầu và được cấp quyền sử dụng. Thông thường quyền này được cấp sau khi thanh toán. Để biết thêm chi tiết, làm theo hướng dẫn của tác giả bên dưới hoặc liên hệ trực tiếp với Trade-o-Scope.
TradingView KHÔNG khuyến nghị bạn trả phí hoặc sử dụng một tập lệnh trừ khi bạn hoàn toàn tin tưởng vào tác giả và hiểu cách hoạt động của tập lệnh. Bạn cũng có thể tìm các lựa chọn miễn phí, mã nguồn mở trong các script cộng đồng của chúng tôi.
Hướng dẫn của tác giả
👉 Gain full access to our invite-only indicators through Patreon
patreon.com/tradeoscope
📺 Check our YouTube
youtube.com/@Trade-o-Scope