OPEN-SOURCE SCRIPT
Cập nhật Range Percentage
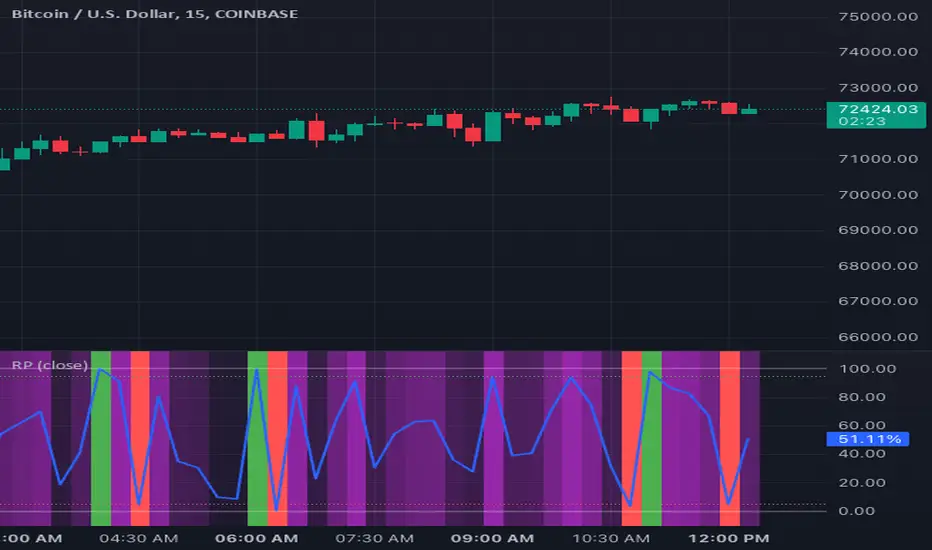
Range Percentage is a simple indicator utility to clearly display and dynamically alert on where a chosen series falls between two bounds, either series themselves or constant values.
To set up, select between series or value for upper and lower bounds. Only the chosen options will be used by the indicator, though you may enter the non-selected option. Configure the thresholds if you wish to use them for visual display or alerting. If you only care about the background color, disable both thresholds and the percentage line and move the indicator into the main pane.
Some sample use cases:
This indicator is often most useful in conjunction with other indicators which produce a plotted series output and can save a lot of time thinking or interpreting. Its usefulness to a trader depends entirely on the rationale for choosing a lower/upper bound and sample series that are meaningful to that trader.
To set up, select between series or value for upper and lower bounds. Only the chosen options will be used by the indicator, though you may enter the non-selected option. Configure the thresholds if you wish to use them for visual display or alerting. If you only care about the background color, disable both thresholds and the percentage line and move the indicator into the main pane.
Some sample use cases:
- Coloring background on a zoomed-in chart to show to show price change relative to the entire value of an asset, not just the range selected on the y-axis
- Get alerts which adjust dynamically as price approaches another series or dynamic value
- Determine at a glance where a price falls between your identified support/resistance lines, no matter where you zoom or scroll
- Compare relative gain of two assets
- Identify trends of a price closing closer to low or high over time
This indicator is often most useful in conjunction with other indicators which produce a plotted series output and can save a lot of time thinking or interpreting. Its usefulness to a trader depends entirely on the rationale for choosing a lower/upper bound and sample series that are meaningful to that trader.
Phát hành các Ghi chú
Range Percentage is a simple indicator utility to clearly display and dynamically alert on where a chosen series falls between two bounds, either series themselves or constant values.To set up, select between series or value for upper and lower bounds. Only the chosen options will be used by the indicator, though you may enter the non-selected option. Configure the thresholds if you wish to use them for visual display or alerting. If you only care about the background color, disable both thresholds and the percentage line and move the indicator into the main pane.
Some sample use cases:
- Coloring background on a zoomed-in chart to show to show price change relative to the entire value of an asset, not just the range selected on the y-axis
- Get alerts which adjust dynamically as price approaches another series or dynamic value
- Determine at a glance where a price falls between your identified support/resistance lines, no matter where you zoom or scroll
- Compare relative gain of two assets
- Identify trends of a price closing closer to low or high over time
This indicator is often most useful in conjunction with other indicators which produce a plotted series output and can save a lot of time thinking or interpreting. Its usefulness to a trader depends entirely on the rationale for choosing a lower/upper bound and sample series that are meaningful to that trader.
Changelog
March 11, 2024 - Initial release
March 19, 2024 - Added multi timeframe support
Mã nguồn mở
Theo đúng tinh thần TradingView, tác giả của tập lệnh này đã công bố nó dưới dạng mã nguồn mở, để các nhà giao dịch có thể xem xét và xác minh chức năng. Chúc mừng tác giả! Mặc dù bạn có thể sử dụng miễn phí, hãy nhớ rằng việc công bố lại mã phải tuân theo Nội quy.
Thông báo miễn trừ trách nhiệm
Thông tin và các ấn phẩm này không nhằm mục đích, và không cấu thành, lời khuyên hoặc khuyến nghị về tài chính, đầu tư, giao dịch hay các loại khác do TradingView cung cấp hoặc xác nhận. Đọc thêm tại Điều khoản Sử dụng.