OPEN-SOURCE SCRIPT
Dline
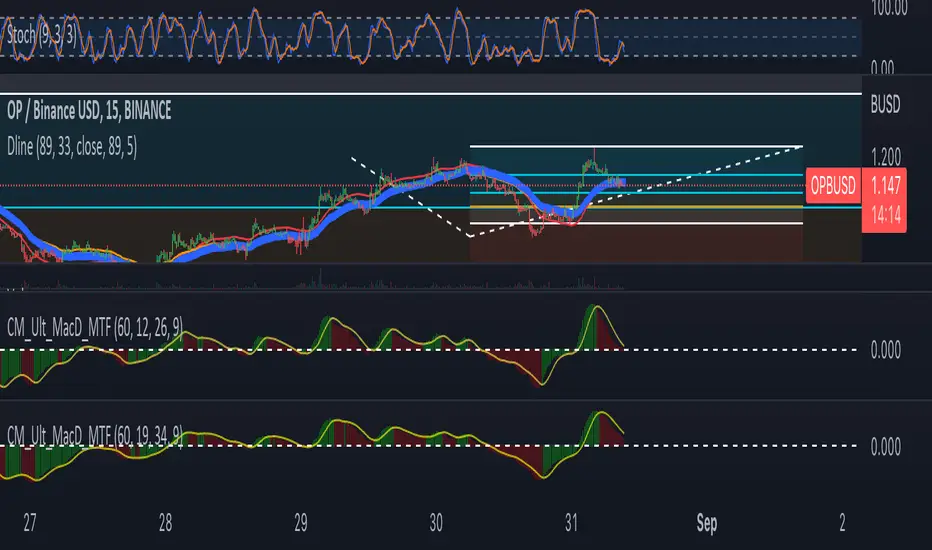
Dline is a indicator that was developed by B-Negative. This indicator was developed under convergence logic. If we have many information of prices, when the information was averaged with more enough, the average line will be the linear line that has direction. The direction of this linear line can help traders to analyze the direction of trends. Dline was made with TEMA, EMA, DEMA, and Dline line that is a average line between DEMA and EMA.
Under B-Negative's concept, DEMA and EMA that are average lines will convergence and have same direction when the trends are coming. Amount of data must more enough and diferrect by assets' type. However, user can change value of DEMA, Dline, EMA, and TEMA by themself under 7 concepts below.
1. EMA will convergence to close Dline when the trend will be changing.
2. The uptrend will occure when EMA above/below Dline and candle sticks are green/red color.
3. TEMA was setted similair DEMA.
4. When new high/low of wave cross TEMA and can not retrun to create higher/lower high/low (At oversold/overbought, Stocastic 9,3,3 counting with loop technique), that is exit point of position.
5. Difference of timeframe or assets could use different parameters. (Setting based on 4 rule above.)
6. Divergence between Dline and EMA mean sentiment of assets are sideways.
7. If Dline and EMA look like same line, the trend is most strength trend.
Dline use thickness = 4
EMA use thickness = 1
This ex. is timeframe day.
Mã nguồn mở
Theo đúng tinh thần TradingView, tác giả của tập lệnh này đã công bố nó dưới dạng mã nguồn mở, để các nhà giao dịch có thể xem xét và xác minh chức năng. Chúc mừng tác giả! Mặc dù bạn có thể sử dụng miễn phí, hãy nhớ rằng việc công bố lại mã phải tuân theo Nội quy.
Thông báo miễn trừ trách nhiệm
Thông tin và các ấn phẩm này không nhằm mục đích, và không cấu thành, lời khuyên hoặc khuyến nghị về tài chính, đầu tư, giao dịch hay các loại khác do TradingView cung cấp hoặc xác nhận. Đọc thêm tại Điều khoản Sử dụng.