OPEN-SOURCE SCRIPT
Custom Support & Resistance Levels (Manual Input)
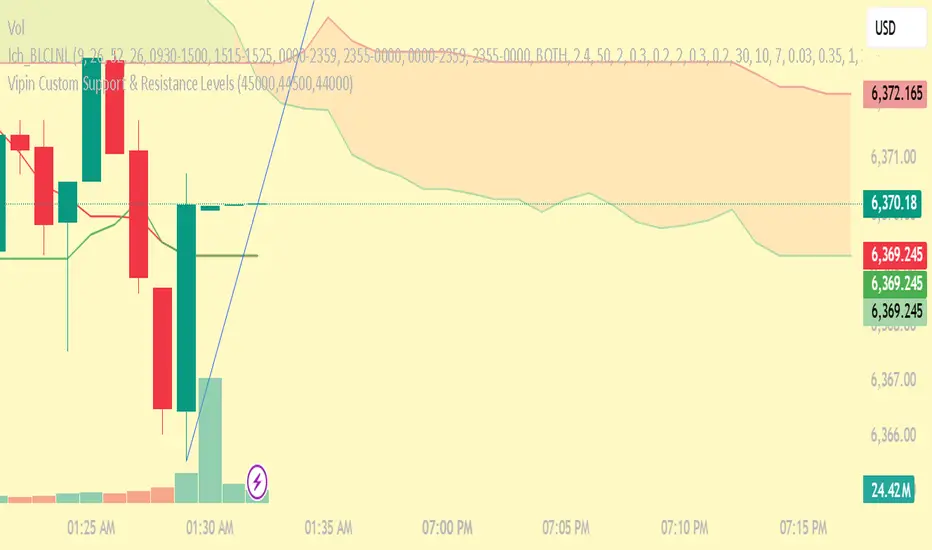
This indicator lets you plot your own support levels (and can be extended for resistance) directly on the chart by entering them as comma-separated values.
📌 Supports manual input for multiple price levels.
📊 Lines are extended across the chart for clear visualization.
🎨 Dynamic coloring:
Green if the current price is above the level.
Red if the current price is below the level.
🧹 Old lines are automatically cleared to avoid clutter.
This tool is ideal if you:
Prefer to mark your own key zones instead of relying only on auto-detected levels.
Want clean and simple visualization of critical price areas.
👉 Coming soon: Resistance levels input (commented in the code, can be enabled).
Mã nguồn mở
Theo đúng tinh thần TradingView, tác giả của tập lệnh này đã công bố nó dưới dạng mã nguồn mở, để các nhà giao dịch có thể xem xét và xác minh chức năng. Chúc mừng tác giả! Mặc dù bạn có thể sử dụng miễn phí, hãy nhớ rằng việc công bố lại mã phải tuân theo Nội quy.
Thông báo miễn trừ trách nhiệm
Thông tin và các ấn phẩm này không nhằm mục đích, và không cấu thành, lời khuyên hoặc khuyến nghị về tài chính, đầu tư, giao dịch hay các loại khác do TradingView cung cấp hoặc xác nhận. Đọc thêm tại Điều khoản Sử dụng.