OPEN-SOURCE SCRIPT
Cập nhật Volatility Adjusted Momentum Signal ETH (VAMS)
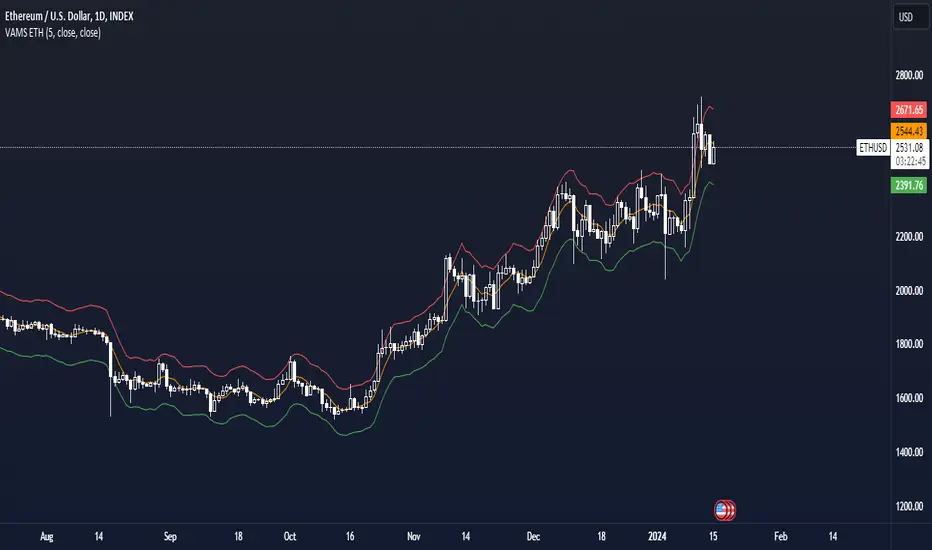
The VAMS ETH indicator is a technical analysis tool designed for Ethereum that aims to provide traders with insights into potential price momentum based on volatility-adjusted price ranges. This indicator is especially useful for identifying periods where the price is likely to experience significant movements away from a defined mean price level.
Key Functions
Volatility Measurement It utilizes a short-term lookback period to measure volatility, calculated as the standard deviation of the closing prices over the user-defined period.
Mean Price Calculation
Simultaneously, it computes the average closing price over the same lookback period to establish a baseline for the current price.
Probable Range Estimation
Using predefined mean percentage changes, the indicator calculates upper and lower boundaries that represent the probable range for price movements. These boundaries are adjusted for volatility, providing a dynamic perspective on where the price is in relation to typical fluctuations.
Signal Visualization
The lower and upper boundaries are plotted on the chart, color-coded in green and red, respectively. These plots help visualize zones where the price might be considered overextended or undervalued based on recent volatility.
The VAMS indicator allows for customization of the lookback period, enabling traders to adjust the sensitivity of the volatility measurement to match their trading style.
Phát hành các Ghi chú
Added plot for the mean priceAdded input for the source of the mean price and volatility
Phát hành các Ghi chú
Cleaned script codeMã nguồn mở
Theo đúng tinh thần TradingView, tác giả của tập lệnh này đã công bố nó dưới dạng mã nguồn mở, để các nhà giao dịch có thể xem xét và xác minh chức năng. Chúc mừng tác giả! Mặc dù bạn có thể sử dụng miễn phí, hãy nhớ rằng việc công bố lại mã phải tuân theo Nội quy.
🔍 Access Investing Strategies & Indicators
📊 whop.com/marktquant
🌐 marktquant.com
Nothing shared on this page constitutes financial advice. All information, tools, and analyses are provided solely for informational and educational purposes.
📊 whop.com/marktquant
🌐 marktquant.com
Nothing shared on this page constitutes financial advice. All information, tools, and analyses are provided solely for informational and educational purposes.
Thông báo miễn trừ trách nhiệm
Thông tin và các ấn phẩm này không nhằm mục đích, và không cấu thành, lời khuyên hoặc khuyến nghị về tài chính, đầu tư, giao dịch hay các loại khác do TradingView cung cấp hoặc xác nhận. Đọc thêm tại Điều khoản Sử dụng.
Mã nguồn mở
Theo đúng tinh thần TradingView, tác giả của tập lệnh này đã công bố nó dưới dạng mã nguồn mở, để các nhà giao dịch có thể xem xét và xác minh chức năng. Chúc mừng tác giả! Mặc dù bạn có thể sử dụng miễn phí, hãy nhớ rằng việc công bố lại mã phải tuân theo Nội quy.
🔍 Access Investing Strategies & Indicators
📊 whop.com/marktquant
🌐 marktquant.com
Nothing shared on this page constitutes financial advice. All information, tools, and analyses are provided solely for informational and educational purposes.
📊 whop.com/marktquant
🌐 marktquant.com
Nothing shared on this page constitutes financial advice. All information, tools, and analyses are provided solely for informational and educational purposes.
Thông báo miễn trừ trách nhiệm
Thông tin và các ấn phẩm này không nhằm mục đích, và không cấu thành, lời khuyên hoặc khuyến nghị về tài chính, đầu tư, giao dịch hay các loại khác do TradingView cung cấp hoặc xác nhận. Đọc thêm tại Điều khoản Sử dụng.