OPEN-SOURCE SCRIPT
RSI Dashboard Multi-TF
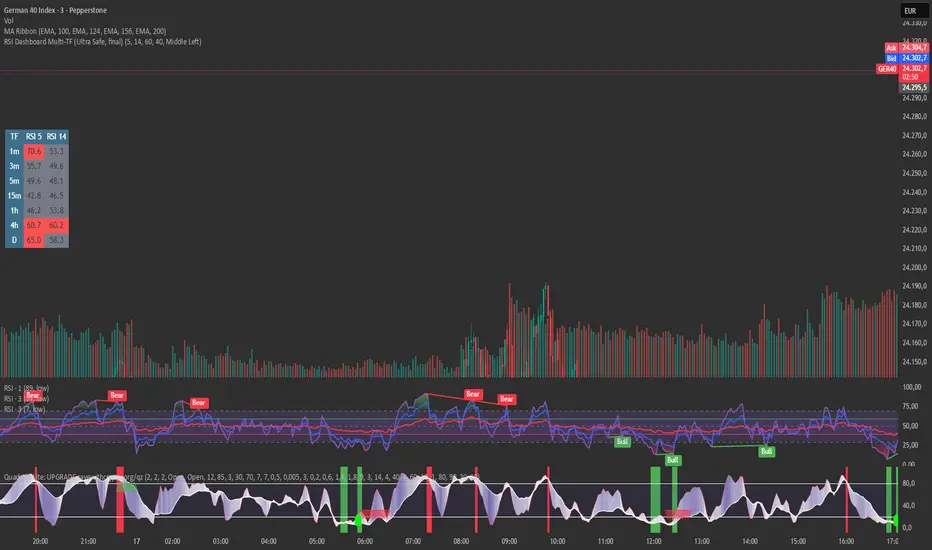
This script displays RSI values from multiple timeframes in a compact dashboard directly on the chart.
It is designed for traders who want to quickly identify whether the market is overbought, oversold, or neutral across different timeframes, without constantly switching chart intervals.
The dashboard shows the RSI simultaneously for the following timeframes:
- 1 minute
- 3 minutes
- 5 minutes
- 15 minutes
- 1 hour
- 4 hours
- Daily
Typical use cases:
- Scalping & intraday trading
- Multi-timeframe analysis at a glance
- Entry confirmation (e.g. pullbacks, breakouts)
- Avoiding trades against overbought or oversold market conditions
- Complementing EMA, VWAP, or price action strategies
⚙️ Notes
This dashboard is an analysis tool, not an automated trading system.
No repainting (uses request.security).
Suitable for indices, forex, crypto, and commodities.
This RSI dashboard provides a fast, clear, and visually clean market overview across multiple timeframes, making it an ideal tool for active traders who want to make efficient and well-structured trading decisions.
Mã nguồn mở
Theo đúng tinh thần TradingView, tác giả của tập lệnh này đã công bố nó dưới dạng mã nguồn mở, để các nhà giao dịch có thể xem xét và xác minh chức năng. Chúc mừng tác giả! Mặc dù bạn có thể sử dụng miễn phí, hãy nhớ rằng việc công bố lại mã phải tuân theo Nội quy.
Thông báo miễn trừ trách nhiệm
Thông tin và các ấn phẩm này không nhằm mục đích, và không cấu thành, lời khuyên hoặc khuyến nghị về tài chính, đầu tư, giao dịch hay các loại khác do TradingView cung cấp hoặc xác nhận. Đọc thêm tại Điều khoản Sử dụng.