OPEN-SOURCE SCRIPT
Percentage Of Rising MA's
Return the percentage of rising moving averages with periods in a custom range from min to max, with the possibility of using different types of moving averages.
Settings
Usages
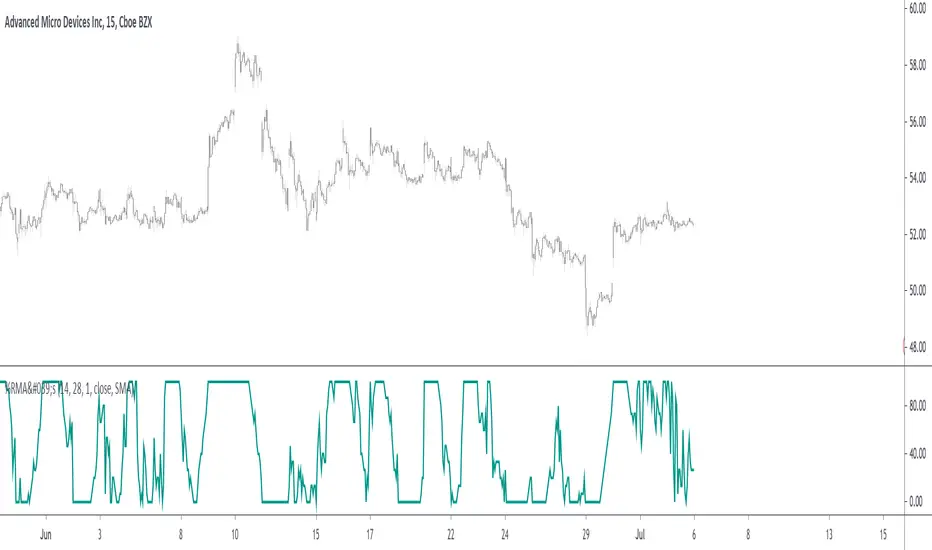
The indicator can return information about the main direction of a trend as well as its overall strength. A value of the indicator above 50 implies that more than 50% of the moving averages from period min to max are rising, this would suggest an uptrend, while a value inferior to 50 would suggest a down-trend.

On the chart, a ribbon consisting of simple moving averages from period 14 to 19, with a color indicating their direction, below the indicator with min = 14 and max = 19
The strength of a trend can be determined by how close the indicator is to 0 or 100, a value of 100 would imply that 100% percent of the moving averages are rising, this indicates a strong up-trend, while a value of 0 would suggest a strong down-trend.
Using different types of moving averages can allow to have more reactive or on the contrary, less noisy results.

Here the type of moving average used by both the ribbon and the indicator is the WMA, the WMA is more reactive than the SMA at the cost of providing less amount of filtering. On the other hand, using a triangular moving average (TMA) provide more filtering at the cost of being less reactive.

Finally, irregularities in the indicator output can be removed by using the smooth setting.

Above smooth = 50.
Details
The indicator is based upon a for loop, this implies that both the sma, wma or change functions are not directly usable, fortunately for us, it is possible to get the first difference of both the SMA, WMA and TMA without relying on a loop by using simple calculations.
The first difference of an SMA of period p is simply a momentum oscillator of period p divided by p, there are two ways to explain why this is the case, first, simple math can prove this, the first difference of an SMA is given by:
Pine Script®
The repeating terms cancel each other out, as such, we end up with
Pine Script®
which is simply a momentum oscillator divided by p, since this division doesn't change the sign of the output we can leave it out. We can also use impulses responses to prove this, the impulse response of a simple moving average is rectangular, taking the first difference of this impulse response will give the impulse response of a momentum oscillator, with the only difference being that the non-zero values of the result will be equal to 1/p instead of 1.

The same thing applies to the WMA

above the impulse response of the first difference of a WMA, we can see it is extremely similar to the one of a high pass SMA, only 1 bar longer, as such we can have the first difference of a WMA quite easily. The TMA is simply a 2 pass SMA (the SMA of an SMA), as such the solution is also simple.
Settings
- Minimum MA Length Value : minimum period of the moving average.
- Maximum MA Length Value : maximum period of the moving average.
- Smooth : determine the period of an EMA using the indicator as input, 1 (no smoothing) by default.
- Src : source input for the moving averages.
- Type : type of the moving averages to be analyzed, available options are "SMA", "WMA" and "TMA", by default "SMA".
Usages
The indicator can return information about the main direction of a trend as well as its overall strength. A value of the indicator above 50 implies that more than 50% of the moving averages from period min to max are rising, this would suggest an uptrend, while a value inferior to 50 would suggest a down-trend.
On the chart, a ribbon consisting of simple moving averages from period 14 to 19, with a color indicating their direction, below the indicator with min = 14 and max = 19
The strength of a trend can be determined by how close the indicator is to 0 or 100, a value of 100 would imply that 100% percent of the moving averages are rising, this indicates a strong up-trend, while a value of 0 would suggest a strong down-trend.
Using different types of moving averages can allow to have more reactive or on the contrary, less noisy results.
Here the type of moving average used by both the ribbon and the indicator is the WMA, the WMA is more reactive than the SMA at the cost of providing less amount of filtering. On the other hand, using a triangular moving average (TMA) provide more filtering at the cost of being less reactive.
Finally, irregularities in the indicator output can be removed by using the smooth setting.
Above smooth = 50.
Details
The indicator is based upon a for loop, this implies that both the sma, wma or change functions are not directly usable, fortunately for us, it is possible to get the first difference of both the SMA, WMA and TMA without relying on a loop by using simple calculations.
The first difference of an SMA of period p is simply a momentum oscillator of period p divided by p, there are two ways to explain why this is the case, first, simple math can prove this, the first difference of an SMA is given by:
(x[0] + x[1] + ... + x[p-1])/p - (x[1] + x[2] + ... + x[p])/p
The repeating terms cancel each other out, as such, we end up with
(x[0] - x[p])/p
which is simply a momentum oscillator divided by p, since this division doesn't change the sign of the output we can leave it out. We can also use impulses responses to prove this, the impulse response of a simple moving average is rectangular, taking the first difference of this impulse response will give the impulse response of a momentum oscillator, with the only difference being that the non-zero values of the result will be equal to 1/p instead of 1.
The same thing applies to the WMA
above the impulse response of the first difference of a WMA, we can see it is extremely similar to the one of a high pass SMA, only 1 bar longer, as such we can have the first difference of a WMA quite easily. The TMA is simply a 2 pass SMA (the SMA of an SMA), as such the solution is also simple.
Mã nguồn mở
Theo đúng tinh thần TradingView, tác giả của tập lệnh này đã công bố nó dưới dạng mã nguồn mở, để các nhà giao dịch có thể xem xét và xác minh chức năng. Chúc mừng tác giả! Mặc dù bạn có thể sử dụng miễn phí, hãy nhớ rằng việc công bố lại mã phải tuân theo Nội quy.
Check out the indicators we are making at luxalgo: tradingview.com/u/LuxAlgo/
"My heart is so loud that I can't hear the fireworks"
"My heart is so loud that I can't hear the fireworks"
Thông báo miễn trừ trách nhiệm
Thông tin và các ấn phẩm này không nhằm mục đích, và không cấu thành, lời khuyên hoặc khuyến nghị về tài chính, đầu tư, giao dịch hay các loại khác do TradingView cung cấp hoặc xác nhận. Đọc thêm tại Điều khoản Sử dụng.