OPEN-SOURCE SCRIPT
Previous Day OHLC
# Previous Day OHLC Levels Indicator
## Overview
The Previous Day OHLC indicator is a simple yet powerful tool that plots the Open, High, Low, and Close levels from previous trading sessions. This indicator helps traders identify key support and resistance levels based on historical price action, making it easier to spot potential reversal zones and breakout levels.
## Key Features
### 📊 **Previous Day OHLC Levels**
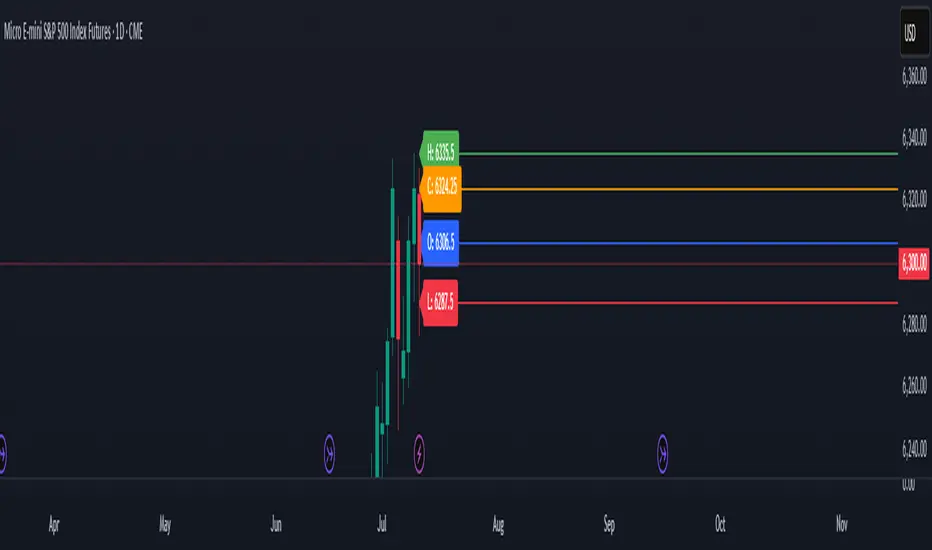
- Displays the Open, High, Low, and Close prices from 1-5 days ago
- Lines automatically extend to the right for easy visualization
- Updates daily to show the most relevant levels
### 🎨 **Fully Customizable Styling**
- **Individual Line Colors**: Choose unique colors for each OHLC level
- **Line Styles**: Select from Solid, Dashed, or Dotted lines for each level
- **Line Width**: Adjust thickness from 1-4 pixels for better visibility
- **Price Labels**: Display actual price values on each line with customizable sizing
### ⚙️ **Flexible Settings**
- **Lookback Period**: Choose to display levels from 1-5 days ago (maximum safety limit)
- **Label Control**: Toggle price labels on/off and adjust their size
- **Performance Optimized**: Clean code that won't slow down your charts
## How to Use
1. **Add to Chart**: Apply the indicator to any timeframe chart
2. **Customize Settings**: Adjust colors, styles, and lookback period to your preference
3. **Identify Levels**: Use the plotted lines as potential support/resistance zones
4. **Trade Setup**: Look for price reactions at these key levels for entry/exit signals
## Best Practices
- **Day Trading**: Use 1-day lookback for intraday support/resistance
- **Swing Trading**: Extend lookback to 2-5 days for broader context
- **Multi-Timeframe**: Combine with other timeframe analysis for confirmation
- **Risk Management**: Use these levels for stop-loss and take-profit placement
## Color Coding (Default)
- **Open**: Blue - Starting price of the previous session
- **High**: Green - Highest price reached
- **Low**: Red - Lowest price reached
- **Close**: Orange - Final price of the session
## Why This Indicator Works
Previous day OHLC levels are among the most watched price points by professional traders. These levels often act as:
- **Support/Resistance**: Price tends to react at these historical levels
- **Breakout Confirmation**: Strong moves beyond these levels can signal trend continuation
- **Reversal Zones**: Price often bounces from these key levels
- **Psychological Levels**: Market participants remember these important price points
## Technical Specifications
- **Pine Script Version**: v6
- **Overlay**: Yes (plots directly on price chart)
- **Performance**: Optimized for smooth chart operation
- **Compatibility**: Works on all timeframes and instruments
Perfect for traders of all experience levels who want to incorporate previous day levels into their technical analysis toolkit!
## Overview
The Previous Day OHLC indicator is a simple yet powerful tool that plots the Open, High, Low, and Close levels from previous trading sessions. This indicator helps traders identify key support and resistance levels based on historical price action, making it easier to spot potential reversal zones and breakout levels.
## Key Features
### 📊 **Previous Day OHLC Levels**
- Displays the Open, High, Low, and Close prices from 1-5 days ago
- Lines automatically extend to the right for easy visualization
- Updates daily to show the most relevant levels
### 🎨 **Fully Customizable Styling**
- **Individual Line Colors**: Choose unique colors for each OHLC level
- **Line Styles**: Select from Solid, Dashed, or Dotted lines for each level
- **Line Width**: Adjust thickness from 1-4 pixels for better visibility
- **Price Labels**: Display actual price values on each line with customizable sizing
### ⚙️ **Flexible Settings**
- **Lookback Period**: Choose to display levels from 1-5 days ago (maximum safety limit)
- **Label Control**: Toggle price labels on/off and adjust their size
- **Performance Optimized**: Clean code that won't slow down your charts
## How to Use
1. **Add to Chart**: Apply the indicator to any timeframe chart
2. **Customize Settings**: Adjust colors, styles, and lookback period to your preference
3. **Identify Levels**: Use the plotted lines as potential support/resistance zones
4. **Trade Setup**: Look for price reactions at these key levels for entry/exit signals
## Best Practices
- **Day Trading**: Use 1-day lookback for intraday support/resistance
- **Swing Trading**: Extend lookback to 2-5 days for broader context
- **Multi-Timeframe**: Combine with other timeframe analysis for confirmation
- **Risk Management**: Use these levels for stop-loss and take-profit placement
## Color Coding (Default)
- **Open**: Blue - Starting price of the previous session
- **High**: Green - Highest price reached
- **Low**: Red - Lowest price reached
- **Close**: Orange - Final price of the session
## Why This Indicator Works
Previous day OHLC levels are among the most watched price points by professional traders. These levels often act as:
- **Support/Resistance**: Price tends to react at these historical levels
- **Breakout Confirmation**: Strong moves beyond these levels can signal trend continuation
- **Reversal Zones**: Price often bounces from these key levels
- **Psychological Levels**: Market participants remember these important price points
## Technical Specifications
- **Pine Script Version**: v6
- **Overlay**: Yes (plots directly on price chart)
- **Performance**: Optimized for smooth chart operation
- **Compatibility**: Works on all timeframes and instruments
Perfect for traders of all experience levels who want to incorporate previous day levels into their technical analysis toolkit!
Mã nguồn mở
Theo đúng tinh thần TradingView, tác giả của tập lệnh này đã công bố nó dưới dạng mã nguồn mở, để các nhà giao dịch có thể xem xét và xác minh chức năng. Chúc mừng tác giả! Mặc dù bạn có thể sử dụng miễn phí, hãy nhớ rằng việc công bố lại mã phải tuân theo Nội quy.
Thông báo miễn trừ trách nhiệm
Thông tin và các ấn phẩm này không nhằm mục đích, và không cấu thành, lời khuyên hoặc khuyến nghị về tài chính, đầu tư, giao dịch hay các loại khác do TradingView cung cấp hoặc xác nhận. Đọc thêm tại Điều khoản Sử dụng.