OPEN-SOURCE SCRIPT
Midpoint of Last 3 Candles
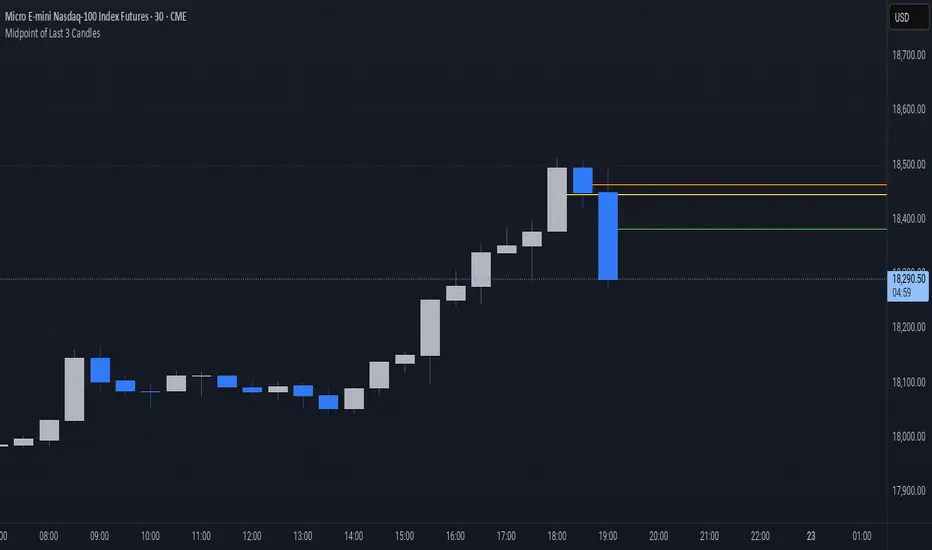
This indicator highlights the market structure by plotting the midpoints of the current and previous two candles. It draws a horizontal line at the average of the high and low for each of these candles, giving a visual cue of the short-term balance point in price action. These midpoints can act as dynamic support and resistance levels, helping traders assess areas of potential reaction or continuation.
Each line is color-coded for clarity: green represents the current candle, orange marks the previous candle, and yellow indicates the one before that. All lines extend into the future on the chart, allowing you to see how price interacts with these levels as new candles form. This simple yet effective tool can be useful in various strategies, especially those focused on price action, scalping, or intraday analysis.
Each line is color-coded for clarity: green represents the current candle, orange marks the previous candle, and yellow indicates the one before that. All lines extend into the future on the chart, allowing you to see how price interacts with these levels as new candles form. This simple yet effective tool can be useful in various strategies, especially those focused on price action, scalping, or intraday analysis.
Mã nguồn mở
Theo đúng tinh thần TradingView, tác giả của tập lệnh này đã công bố nó dưới dạng mã nguồn mở, để các nhà giao dịch có thể xem xét và xác minh chức năng. Chúc mừng tác giả! Mặc dù bạn có thể sử dụng miễn phí, hãy nhớ rằng việc công bố lại mã phải tuân theo Nội Quy.
Thông báo miễn trừ trách nhiệm
Thông tin và các ấn phẩm này không nhằm mục đích, và không cấu thành, lời khuyên hoặc khuyến nghị về tài chính, đầu tư, giao dịch hay các loại khác do TradingView cung cấp hoặc xác nhận. Đọc thêm tại Điều khoản Sử dụng.