OPEN-SOURCE SCRIPT
Cập nhật Average Daily Range Tracker

Average Daily Range Tracker
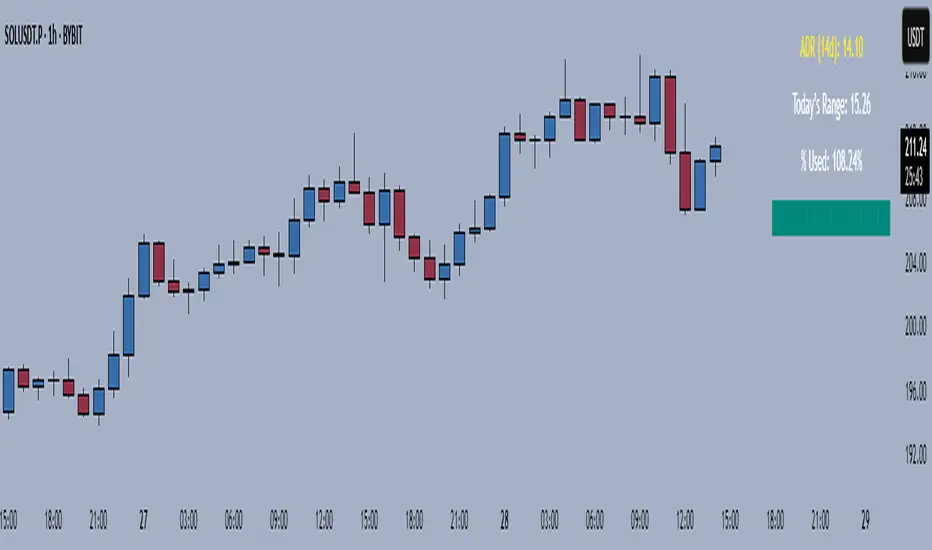
This indicator helps you measure volatility in real time by tracking the Average Daily Range (ADR) and comparing it to the current day’s price action.
🔑 Features
Calculates the ADR over a user-defined lookback period (default = 14 days).
Displays today’s developing range (High–Low) as the session unfolds.
Shows what % of the ADR has already been consumed intraday.
Visual progress bar makes it easy to see how close today is to its historical average range.
Optional ADR plot available in a separate pane.
📈 How traders use it
Spot when a market has already made its “typical” daily move.
Adjust intraday trade expectations: avoid chasing after the bulk of the move is done.
Use % of ADR consumed as a volatility filter for setups.
Combine with support/resistance to identify exhaustion zones.
⚙️ Customization
Lookback length for ADR calculation.
Progress bar size and color.
Optional toggle to plot ADR in its own panel.
Phát hành các Ghi chú
Average Daily Range TrackerThis script calculates and tracks the true Average Daily Range (ADR) of the last N daily candles — regardless of what timeframe you’re currently viewing. Unlike many ADR tools that recalc when you switch charts, this version is locked to daily data only, ensuring consistent results.
Features:
✅ ADR based on the last X daily candles (default = 14).
✅ Displays today’s developing daily range in real-time.
✅ Progress bar shows how much of the ADR has been used.
✅ Optional ADR plot (on a separate scale).
✅ Clean table overlay in the top-right corner.
Use case:
Quickly see the average daily volatility of your ticker and how today’s move stacks up against it. Helps with setting realistic targets, stops, and gauging when a move may be stretched.
Mã nguồn mở
Theo đúng tinh thần TradingView, tác giả của tập lệnh này đã công bố nó dưới dạng mã nguồn mở, để các nhà giao dịch có thể xem xét và xác minh chức năng. Chúc mừng tác giả! Mặc dù bạn có thể sử dụng miễn phí, hãy nhớ rằng việc công bố lại mã phải tuân theo Nội quy.
Thông báo miễn trừ trách nhiệm
Thông tin và các ấn phẩm này không nhằm mục đích, và không cấu thành, lời khuyên hoặc khuyến nghị về tài chính, đầu tư, giao dịch hay các loại khác do TradingView cung cấp hoặc xác nhận. Đọc thêm tại Điều khoản Sử dụng.