OPEN-SOURCE SCRIPT
Monthly Price Insights V1 [PINESCRIPTLABS]
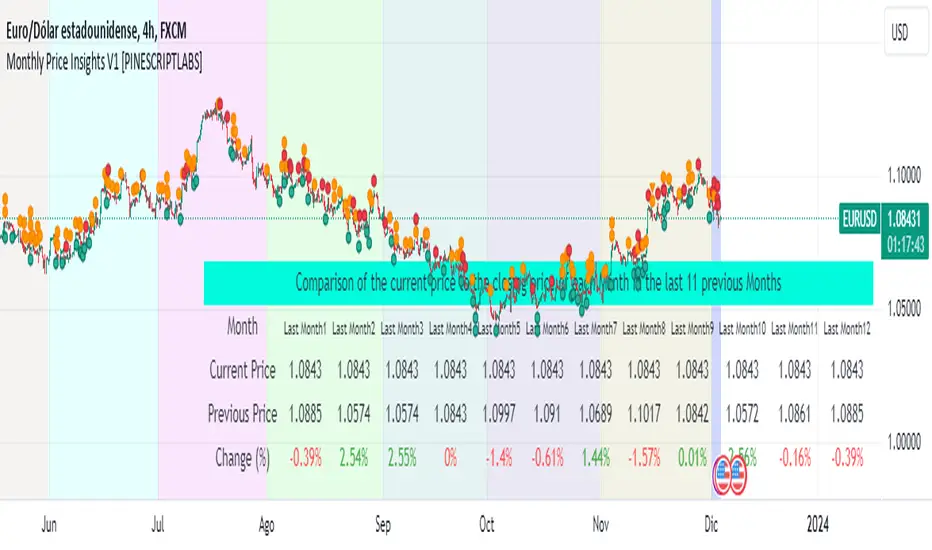
This indicator displays a chart table that compares the current price of the asset with the closing prices of the last 12 months. This table includes columns for the month, the current price, the previous price, and the percentage change.

Monthly Color Visualization: The indicator uses unique colors for each month, facilitating quick identification of the current and previous periods on the trading chart.

Calculation of Percentage Changes: The indicator calculates the percentage change in price from the previous month, providing a clear perspective on the price trend over time.
Dynamic Data Update: It automatically updates to reflect changes in the asset's price.

Español:
Este indicador muestra una tabla en el gráfico que compara el precio actual del activo con los precios de cierre de los últimos 12 meses. Esta tabla incluye columnas para el mes, el precio actual, el precio anterior y el cambio porcentual.
[imagen][/imagen]
Visualización por Colores Mensuales: El indicador utiliza colores únicos para cada mes, facilitando la identificación rápida del periodo actual y los anteriores en el gráfico de trading.
[imagen][/imagen]
Cálculo de Cambios Porcentuales: El indicador calcula el cambio porcentual en el precio desde el mes anterior, proporcionando una perspectiva clara de la tendencia del precio a lo largo del tiempo.
Actualización Dinámica de Datos: Se actualiza automáticamente para reflejar los cambios en el precio del activo.
[imagen][/imagen]
Monthly Color Visualization: The indicator uses unique colors for each month, facilitating quick identification of the current and previous periods on the trading chart.
Calculation of Percentage Changes: The indicator calculates the percentage change in price from the previous month, providing a clear perspective on the price trend over time.
Dynamic Data Update: It automatically updates to reflect changes in the asset's price.
Español:
Este indicador muestra una tabla en el gráfico que compara el precio actual del activo con los precios de cierre de los últimos 12 meses. Esta tabla incluye columnas para el mes, el precio actual, el precio anterior y el cambio porcentual.
[imagen]
Visualización por Colores Mensuales: El indicador utiliza colores únicos para cada mes, facilitando la identificación rápida del periodo actual y los anteriores en el gráfico de trading.
[imagen]
Cálculo de Cambios Porcentuales: El indicador calcula el cambio porcentual en el precio desde el mes anterior, proporcionando una perspectiva clara de la tendencia del precio a lo largo del tiempo.
Actualización Dinámica de Datos: Se actualiza automáticamente para reflejar los cambios en el precio del activo.
[imagen]
Mã nguồn mở
Theo đúng tinh thần TradingView, tác giả của tập lệnh này đã công bố nó dưới dạng mã nguồn mở, để các nhà giao dịch có thể xem xét và xác minh chức năng. Chúc mừng tác giả! Mặc dù bạn có thể sử dụng miễn phí, hãy nhớ rằng việc công bố lại mã phải tuân theo Nội quy.
Thông báo miễn trừ trách nhiệm
Thông tin và các ấn phẩm này không nhằm mục đích, và không cấu thành, lời khuyên hoặc khuyến nghị về tài chính, đầu tư, giao dịch hay các loại khác do TradingView cung cấp hoặc xác nhận. Đọc thêm tại Điều khoản Sử dụng.