OPEN-SOURCE SCRIPT
Cập nhật Timeframe Pivots
Use this tool to plot open prices from any timeframe as a pivot level with the option to go advanced and turn on extensions (instructions below), which review the relationship between previous and current open prices to build range extensions up to six levels wide.
Please be aware extensions, nor vwap are not enabled by default! It is up to the user to determine how they wish to setup this indicator. Please read the full description for utilizing this indicator so that it's well known the complete feature set and understanding of how to enable additional plots, complete instruction is provided for all users below.
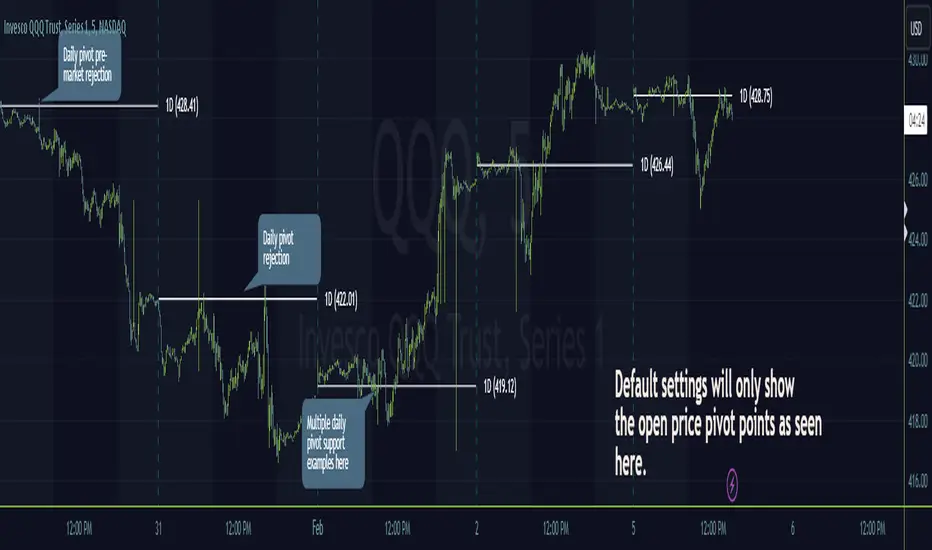
Default configuration example:
https://www.tradingview.com/x/ZMz3K1oD/
To enable extensions the user must open the indicator configuration by clicking the gear icon for "Timeframe Pivots", depending on screen resolution scrolling with mouse may need to occur in order to find the section labeled "Extensions", use the mouse or equivalent human interface device to check the checkbox to the right of the color plots and line type drop down.
Extensions enabled example:
https://www.tradingview.com/x/ZR2sTllc/
Timeframe Selection
Timeframes available to the indicator are any timeframe the platform makes available to the user by default, or also if the TradingView user has higher tier plan to create custom timeframes - those should be available as well. To adjust timeframe the user must open the indicator configuration by clicking the gear icon for "Timeframe Pivots", depending on screen resolution scrolling with mouse may need to occur in order to find the input labeled "Timeframe", use the mouse or equivalent human interface device select the drop down and select timeframe suitable to users application.
How the extension width and extensions are calculated:
The exact process takes the new timeframe change open price calculates the difference between prior open, once that has been completed then it's divided in half to build extensions.
Code example:
Pine Script®
How the extensions are calculated:
Pine Script®
+1 Extension:
Pine Script®
-1 Extension:
Pine Script®
So it should be established how each projected extension, either positive or negative, is created.
Range bound market detection and notes:
One note regarding the ranges, sometimes the open prices of each period can be close in proximity to their predecessor, there's not enough range to build meaningful projections. In these situations this means the market is most likely range bound and prior range data is utilized to continue providing guidance. This addresses an issue with other pivot indicators that will instead blindly follow price and present useless pivot ranges.
It does this through detection of average half range widths, the last 14 ranges to be exact, if the current, (open - open[1] / 2), half range width is smaller than the average, prior half range width will be used.
Code example:
Pine Script®
In the code example above if the new half range width was above or equal to the rolling average, no adjustment would be made by the indicator.
VWAP
Additional feature of showing vwap, anchored to the same timeframe as the pivot, provides a trend and volume analysis within the confines of the pivots range.
The user must open the indicator configuration by clicking the gear icon for "Timeframe Pivots", scroll using mouse to the "VWAP" section and click the checkbox next to the "Source" field, past the color plots. They are not enabled by default!
The user can also add the bands for VWAP by clicking the checkbox next to the "Bands" field, past the color plots. They are not enabled by default!
VWAP calculations begin from open price of new timeframe change, then afterwards the "Source" set is utilized, the default is HLC3 which is standard for VWAP indicators.
Multiple Timeframe Analysis (MTFA)
It's simple to create a unique combination of favored timeframes for multiple timeframe analysis, consider daily, weekly and monthly combined analysis for powerful indications of market sentiment and directional bias.
Example MTFA demonstration:
https://www.tradingview.com/x/X7dUMrzy/
Why was this created?
I created this while investigating the efficacy of open price ranges, it became apparent that these pivot ranges are some of the more price respecting pivots I've ever observed. I also grew tired of lack of price adherence to other pivot indicators widely available.
There exists a relationship between each timeframes open price in comparison to prior open price, if the market is willing to navigate to a prior lower open price from higher open price, it could be perceived as bearish and the extensions (if enabled as instructed above), could be suitable range based projections for future price movements.
Example comparison:
https://www.tradingview.com/x/XnOHu48T/
As can be seen, and there are many examples, where Timeframe Pivots provides more discreet levels and potential explanations for price movements.
Please be aware extensions, nor vwap are not enabled by default! It is up to the user to determine how they wish to setup this indicator. Please read the full description for utilizing this indicator so that it's well known the complete feature set and understanding of how to enable additional plots, complete instruction is provided for all users below.
Default configuration example:
https://www.tradingview.com/x/ZMz3K1oD/
To enable extensions the user must open the indicator configuration by clicking the gear icon for "Timeframe Pivots", depending on screen resolution scrolling with mouse may need to occur in order to find the section labeled "Extensions", use the mouse or equivalent human interface device to check the checkbox to the right of the color plots and line type drop down.
Extensions enabled example:
https://www.tradingview.com/x/ZR2sTllc/
Timeframe Selection
Timeframes available to the indicator are any timeframe the platform makes available to the user by default, or also if the TradingView user has higher tier plan to create custom timeframes - those should be available as well. To adjust timeframe the user must open the indicator configuration by clicking the gear icon for "Timeframe Pivots", depending on screen resolution scrolling with mouse may need to occur in order to find the input labeled "Timeframe", use the mouse or equivalent human interface device select the drop down and select timeframe suitable to users application.
How the extension width and extensions are calculated:
The exact process takes the new timeframe change open price calculates the difference between prior open, once that has been completed then it's divided in half to build extensions.
Code example:
Extension Width = (Open - Open[1]) / 2
How the extensions are calculated:
// +1 for positive extension, -1 for negative extension
(Extension Width * (Configured Multiplier * 1)) + Pivot Open Price
+1 Extension:
$5 * (1.0 * 1) + $400 = $405
-1 Extension:
$5 * (1.0 * -1) + $400 = $395
So it should be established how each projected extension, either positive or negative, is created.
Range bound market detection and notes:
One note regarding the ranges, sometimes the open prices of each period can be close in proximity to their predecessor, there's not enough range to build meaningful projections. In these situations this means the market is most likely range bound and prior range data is utilized to continue providing guidance. This addresses an issue with other pivot indicators that will instead blindly follow price and present useless pivot ranges.
It does this through detection of average half range widths, the last 14 ranges to be exact, if the current, (open - open[1] / 2), half range width is smaller than the average, prior half range width will be used.
Code example:
// assume past half range widths are 10, 8, 9, 5, 14, 7, 7, 9, 10, 10, 4, 7, 7, 8
float v_halfRangeWidthToUseForExtensions = na
v_priorHalfRangeWidth = 10
v_avgHalfRangeWidth = 8.2 // past range widths sum = 115 / 14
v_newHalfRangeWidthToUseForExtensions = 2 // new open - open[1] is tiny compared to avg
if v_newHalfRangeWidthToUseForExtensions < v_avgHalfRangeWidth
// replace new half range width with previous one
v_newHalfRangeWidthToUseForExtensions := v_priorHalfRangeWidth
In the code example above if the new half range width was above or equal to the rolling average, no adjustment would be made by the indicator.
VWAP
Additional feature of showing vwap, anchored to the same timeframe as the pivot, provides a trend and volume analysis within the confines of the pivots range.
The user must open the indicator configuration by clicking the gear icon for "Timeframe Pivots", scroll using mouse to the "VWAP" section and click the checkbox next to the "Source" field, past the color plots. They are not enabled by default!
The user can also add the bands for VWAP by clicking the checkbox next to the "Bands" field, past the color plots. They are not enabled by default!
VWAP calculations begin from open price of new timeframe change, then afterwards the "Source" set is utilized, the default is HLC3 which is standard for VWAP indicators.
Multiple Timeframe Analysis (MTFA)
It's simple to create a unique combination of favored timeframes for multiple timeframe analysis, consider daily, weekly and monthly combined analysis for powerful indications of market sentiment and directional bias.
Example MTFA demonstration:
https://www.tradingview.com/x/X7dUMrzy/
Why was this created?
I created this while investigating the efficacy of open price ranges, it became apparent that these pivot ranges are some of the more price respecting pivots I've ever observed. I also grew tired of lack of price adherence to other pivot indicators widely available.
There exists a relationship between each timeframes open price in comparison to prior open price, if the market is willing to navigate to a prior lower open price from higher open price, it could be perceived as bearish and the extensions (if enabled as instructed above), could be suitable range based projections for future price movements.
Example comparison:
https://www.tradingview.com/x/XnOHu48T/
As can be seen, and there are many examples, where Timeframe Pivots provides more discreet levels and potential explanations for price movements.
Phát hành các Ghi chú
By request added ability to adjust label offset, default is -1 to tuck close to pivot and extension lines but adjusting to positive numbers will allow the label to move further away from lines.Phát hành các Ghi chú
- Added option to select anchor source for pivots, I still highly recommend open price.
- Added four more extension multipliers to support traders using fib levels.
Mã nguồn mở
Theo đúng tinh thần TradingView, tác giả của tập lệnh này đã công bố nó dưới dạng mã nguồn mở, để các nhà giao dịch có thể xem xét và xác minh chức năng. Chúc mừng tác giả! Mặc dù bạn có thể sử dụng miễn phí, hãy nhớ rằng việc công bố lại mã phải tuân theo Nội quy.
@tradeseekers (YouTube, Twitter)
Thông báo miễn trừ trách nhiệm
Thông tin và các ấn phẩm này không nhằm mục đích, và không cấu thành, lời khuyên hoặc khuyến nghị về tài chính, đầu tư, giao dịch hay các loại khác do TradingView cung cấp hoặc xác nhận. Đọc thêm tại Điều khoản Sử dụng.