INVITE-ONLY SCRIPT
MarketReader_Strategy
Cập nhật
MarketReader_Strategy is a very useful and advanced indicator:
- It draws buying (green) and selling (orange) zone.
-Once the buying or selling zone is tapped, the color is automatically changed to grey
-It shows liquidity pool ($$$) engineered by market behaviour
Buying or selling area are determined by an algorithm that combines volume profile, Elliott Wave principles and order flow delivery.
On the above example:
At “1”, you can see that the first buying zone is drawn since January 12
At “2”, the buying zone is tapped on January 18 with a strong bullish reaction.
At “3” and “3’”, you can see that liquidity pool has been created by market maker on both buying and selling side. It is typical of market behavior.
Market maker will take the downside liquidity by targeting the buying zone and then reverse (to the upside) targeting the upside liquidity pool that fuel the pump to the selling zone “4”. This selling zone is reached at “5” with a strong bearish reaction.
“6” represent active buying zone, waiting to be tapped.
To buy or take profit on these areas will depend on market behavior on the way down. Does the market engineer liquidity before? We use 2 complementary indicators helping us to take position on these areas but feel free to experiment with your own.
Usually, I wait price comes to selling or buying zone, then I go on lower timeframe (15 to 30 times lower) searching for divergences and convergences on Momemtum reader (also available on tradingview)
This indicator does not repaint and works on Forex, Crypto, Indices, Commodities and stock.
Phát hành các Ghi chú
Minor bug correctionPhát hành các Ghi chú
Minor bug correctionPhát hành các Ghi chú
Major update:-Optimisation of Orderblock/POI/Supply/demand zone filtering
-Adding FVG-Imbalance plotting
-Automatic plot of Asian range High-Low and its SD (S1-2 R1-2)
-Automatic plot of London High-Low
-Automatic plot of Previous Daily and Weekly High and Low
-Automatic plot of Liquidity pool ($ symbol)
So many people think that POI/OB/Supply-Demand zone are just the last bullish or bearish candle but it is more complicated than that. Our algorithm performs an advanced filtering according to volume, market structure, and oderflow.
All options are customizable.
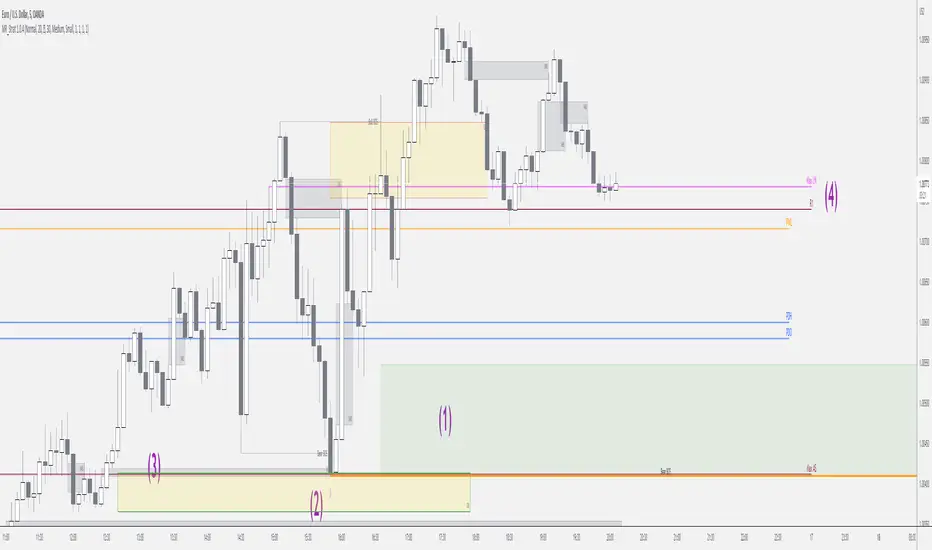
in the graph:
(1) Untouched OrderBlock/POI/etc
(2) Consummed OrderBloc/POI/etc => Nice bounce on it ;-)
(3) Imbalance juste above OB
(4) London and Asian High-Low// Previous daily and Weekly High-Low
Phát hành các Ghi chú
Minor update:-correction of Volatility support and resistance
-Add option
Tập lệnh chỉ hiển thị cho người được mời
Quyền truy cập vào tập lệnh này bị hạn chế đối với người dùng được tác giả ủy quyền và thường yêu cầu thanh toán. Bạn có thể thêm nó vào mục yêu thích của mình, nhưng bạn sẽ chỉ có thể sử dụng nó sau khi yêu cầu sự cho phép từ tác giả. Liên hệ nonobdx để thêm thông tin, hoặc làm theo hướng dẫn của tác giả bên dưới.
TradingView gợi ý bạn không trả tiền để sử dụng tập lệnh trừ khi bạn tin tưởng 100% vào tác giả của tập lệnh và hiểu cách hoạt động của tập lệnh. Trong nhiều trường hợp, bạn có thể tìm thấy giải pháp thay thế nguồn mở tốt miễn phí trong Tập lệnh cộng đồng của chúng tôi.
Bạn muốn sử dụng tập lệnh này trên biểu đồ?
Cảnh báo: vui lòng đọc trước khi yêu cầu quyền truy cập.
Apprendre la méthode:
discord.gg/b7YGtY2
Site internet: marketreader.fr/
Chaine Youtube : youtube.com/channel/UC-a7p8DkfbDM6ONrTzsaErA?view_as=subscriber
discord.gg/b7YGtY2
Site internet: marketreader.fr/
Chaine Youtube : youtube.com/channel/UC-a7p8DkfbDM6ONrTzsaErA?view_as=subscriber
Thông báo miễn trừ trách nhiệm
Thông tin và ấn phẩm không có nghĩa là và không cấu thành, tài chính, đầu tư, kinh doanh, hoặc các loại lời khuyên hoặc khuyến nghị khác được cung cấp hoặc xác nhận bởi TradingView. Đọc thêm trong Điều khoản sử dụng.