OPEN-SOURCE SCRIPT
Ichimoku Cloud Strategy v2.0
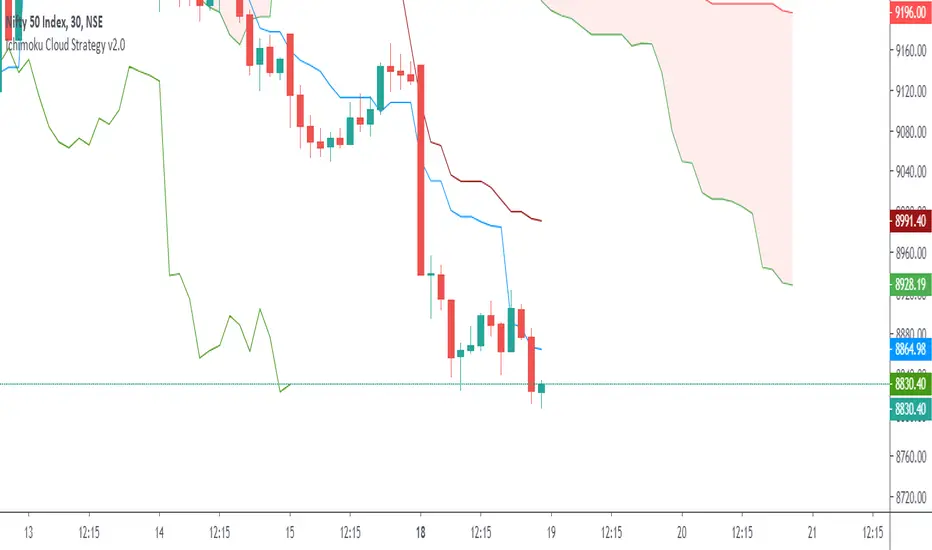
Trend following trading strategy “Ichimoku Crossover” is a popular Ichimoku trading strategy that uses the cloud and crossover of two base lines to define the market reverse point. Ichimoku crossover trading strategy has appeared to be a profitable trading strategy.
The indicator has 5 base lines and to read Ichimoku indicator it is required to understand the meaning of these lines first of all:
Tenkan-Sen line, also called the Conversion Line, represents the midpoint of the last 9 candlesticks . It is calculated with the following Ichimoku formula: .
Kijun-Sen line, also called the Base Line, represents the midpoint of the last 26 candlesticks . It is calculated with the following formula: .
Chiou Span, also called the Lagging Span, lags behind the price (as the name suggests). The Lagging Span is plotted 26 periods back.
Senkou Span A, also called the Leading Span A, represents one of the two Cloud boundaries and it’s the midpoint between the Conversion Line and the Base Line: . This value is plotted 26 periods into the future and it’s the faster Cloud boundary.
Senkou Span B, or the Leading Span B, represents the second Cloud boundaries and it’s the midpoint of the last 52 price bars: . This value is plotted 52 periods into the future and it is the slower Cloud boundary.
Trading with Ichimoku is very simple.
The Conversion Line needs to break above the Base Line. This will be a buy signal.
For a bearish (sell) signal a trader should wait for the Conversion line crosses the Base line downwards it is a sell signal.
Mã nguồn mở
Theo đúng tinh thần TradingView, tác giả của tập lệnh này đã công bố nó dưới dạng mã nguồn mở, để các nhà giao dịch có thể xem xét và xác minh chức năng. Chúc mừng tác giả! Mặc dù bạn có thể sử dụng miễn phí, hãy nhớ rằng việc công bố lại mã phải tuân theo Nội quy.
Thông báo miễn trừ trách nhiệm
Thông tin và các ấn phẩm này không nhằm mục đích, và không cấu thành, lời khuyên hoặc khuyến nghị về tài chính, đầu tư, giao dịch hay các loại khác do TradingView cung cấp hoặc xác nhận. Đọc thêm tại Điều khoản Sử dụng.