OPEN-SOURCE SCRIPT
Fibonacci Toolkit [LuxAlgo]
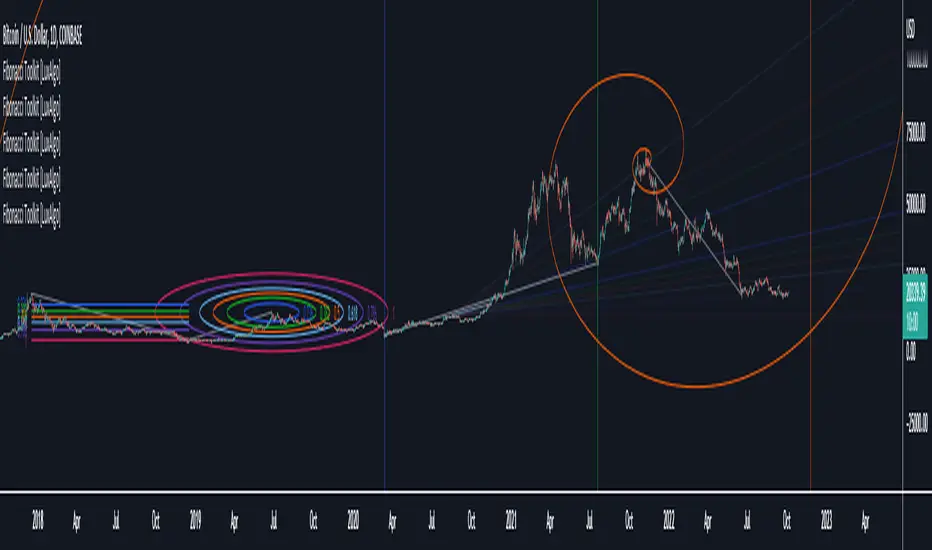
This toolkit aims to display multiple Fibonacci drawing tools including retracements, arcs, circles, fans, timezones and spirals.
Usage
Upon adding the indicator to the chart, users will be prompted to choose a starting point and an ending point for the calculation of the drawing tools.
Users can then navigate to the settings of the toolkit and choose which drawing tool to display using the Fibonacci drop-down menu. Users are also free to change the default Fibonacci ratios used by the indicator from within the settings. Each tool is described below.
Retracements

Fibonacci retracements display multiple levels constructed using the starting price point, ending price point, and multiple Fibonacci ratios. These levels can be used as support and resistance.
Arcs

Fibonacci arcs display multiple semi-circles. Each semi-circle crosses the line connecting the starting & end price point at a certain percentage determined by Fibonacci ratios. These arcs can be used as support and resistance.
Circles

The Fibonacci circles are similar to the Fibonacci arcs but display a full circle instead. Users can expect the price to bounce off of the circles.
This tool is less commonly used by traders.
Fan

A Fibonacci fan is a tool displaying trendlines all connected to a starting point and extending to a point determined by Fibonacci ratios. These can also be used as support and resistance.
Timezone

Fibonacci timezones return a series of horizontal lines. The distance of the lines increases by a factor given by the numbers in the Fibonacci sequence.
This tool can be useful to highlight points where a trend might reverse assuming that their duration increases over time.
Spiral

The Fibonnaci spiral displays a spiral that grows by a factor given by the golden ratio. This indicator returns a spiral using 7 turns (5 internal) and sets the origin of the spiral to the ending point which is selected by the user. The height of the spiral is based on the price range between the starting point and ending point.
Note that potential display artifacts can be seen when fitting the spiral on stocks and forex pairs.
Usage
Upon adding the indicator to the chart, users will be prompted to choose a starting point and an ending point for the calculation of the drawing tools.
Users can then navigate to the settings of the toolkit and choose which drawing tool to display using the Fibonacci drop-down menu. Users are also free to change the default Fibonacci ratios used by the indicator from within the settings. Each tool is described below.
Retracements
Fibonacci retracements display multiple levels constructed using the starting price point, ending price point, and multiple Fibonacci ratios. These levels can be used as support and resistance.
Arcs
Fibonacci arcs display multiple semi-circles. Each semi-circle crosses the line connecting the starting & end price point at a certain percentage determined by Fibonacci ratios. These arcs can be used as support and resistance.
Circles
The Fibonacci circles are similar to the Fibonacci arcs but display a full circle instead. Users can expect the price to bounce off of the circles.
This tool is less commonly used by traders.
Fan
A Fibonacci fan is a tool displaying trendlines all connected to a starting point and extending to a point determined by Fibonacci ratios. These can also be used as support and resistance.
Timezone
Fibonacci timezones return a series of horizontal lines. The distance of the lines increases by a factor given by the numbers in the Fibonacci sequence.
This tool can be useful to highlight points where a trend might reverse assuming that their duration increases over time.
Spiral
The Fibonnaci spiral displays a spiral that grows by a factor given by the golden ratio. This indicator returns a spiral using 7 turns (5 internal) and sets the origin of the spiral to the ending point which is selected by the user. The height of the spiral is based on the price range between the starting point and ending point.
Note that potential display artifacts can be seen when fitting the spiral on stocks and forex pairs.
Phát hành các Ghi chú
Minor changes.Mã nguồn mở
Theo đúng tinh thần TradingView, tác giả của tập lệnh này đã công bố nó dưới dạng mã nguồn mở, để các nhà giao dịch có thể xem xét và xác minh chức năng. Chúc mừng tác giả! Mặc dù bạn có thể sử dụng miễn phí, hãy nhớ rằng việc công bố lại mã phải tuân theo Nội quy.
Get exclusive indicators & AI trading strategies: luxalgo.com
Free 150k+ community: discord.gg/lux
All content provided by LuxAlgo is for informational & educational purposes only. Past performance does not guarantee future results.
Free 150k+ community: discord.gg/lux
All content provided by LuxAlgo is for informational & educational purposes only. Past performance does not guarantee future results.
Thông báo miễn trừ trách nhiệm
Thông tin và các ấn phẩm này không nhằm mục đích, và không cấu thành, lời khuyên hoặc khuyến nghị về tài chính, đầu tư, giao dịch hay các loại khác do TradingView cung cấp hoặc xác nhận. Đọc thêm tại Điều khoản Sử dụng.
Mã nguồn mở
Theo đúng tinh thần TradingView, tác giả của tập lệnh này đã công bố nó dưới dạng mã nguồn mở, để các nhà giao dịch có thể xem xét và xác minh chức năng. Chúc mừng tác giả! Mặc dù bạn có thể sử dụng miễn phí, hãy nhớ rằng việc công bố lại mã phải tuân theo Nội quy.
Get exclusive indicators & AI trading strategies: luxalgo.com
Free 150k+ community: discord.gg/lux
All content provided by LuxAlgo is for informational & educational purposes only. Past performance does not guarantee future results.
Free 150k+ community: discord.gg/lux
All content provided by LuxAlgo is for informational & educational purposes only. Past performance does not guarantee future results.
Thông báo miễn trừ trách nhiệm
Thông tin và các ấn phẩm này không nhằm mục đích, và không cấu thành, lời khuyên hoặc khuyến nghị về tài chính, đầu tư, giao dịch hay các loại khác do TradingView cung cấp hoặc xác nhận. Đọc thêm tại Điều khoản Sử dụng.