[HuD] Master
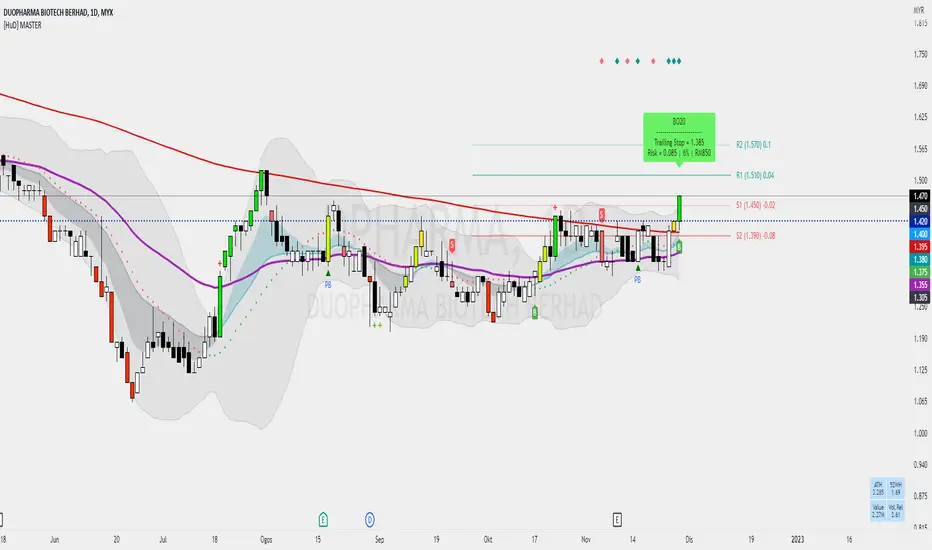
1️⃣ Two EMA lines are used to create the band, which are EMA 8 and EMA 21
When EMA 8 value > EMA21 value, the band color is filled with green and when EMA 8 < EMA21, band is grey
Green means uptrend mode and grey downtrend mode.
2️⃣ EMA50 (purple color)
EMA50 act as a trend indicator, which indicates whether the chart is uptrend or downtrend
3️⃣ Simple Moving Average (SMA200), red line act as a long-term trend guide.
Chart is in strong uptrend when candles are above EMA50 and SMA200
4️⃣ There are 5 signals generated that act as signals to help traders (Bursa Malaysia) in making decisions for Long position.
🔸BUY Signal (B) and SELL (S)
- generated using ATR with default setting set to, ATR Length = 20 , and ATR Multification = 1.7
- trader can make Buy position from that candle or monitor and enter enter after few candle after BUY Signal
- SELL (S) signal is exit signal = red candle, when it break ATR Trailing stop
🔸PB Signal
- signal generated using Stochastic and when candle rebound from EMA10, EMA20 and EMA50
- this is the most safest Entry since it nearest to support area
🔸BO5 ( Light Green Candle )
- When candle breakout the highest previous five candles with significant volume
- Indicates that there's a sign of interest in buying power in the market
- Another opportunity to enter the market either at the current candle or wait for the right time when it retraces
🔸BO20 ( Green Candle )
- When candle breakout the highest previous twenty candles with significant volume
- In daily chart this candle is consider very important as it is the highest monthly candle.
v. ATOM ( Yellow Candle )
- when candle able to break the LineAtom
- LineAtom = sma (close, 20) + (1 * stdev(close, 20))
- ATOM candle indicates there is momentum for candle to move forward towards Top BB
5️⃣ Other Features from Indicator :
🔹Built-in Gann Lines
- Gann Lines is generated from the calculation and reference of Gann Square 9 Table
- It act as a guide for support and resistance .
- Exit position when it breaks the support or as Take Profit (TP) when it reaches the desired resistance.
🔹Tables
- showing the value of All Time High and 52-Week-High
- show the estimation value of current trade ( volume * close price )
- show the value of volume relative
🔹Golden Cross and Death Cross
- act as guide when there's a crossing between short EMA and long EMA lines
- Below are pair of EMAs used :
🔘EMA5 and EMA20
🔘EMA20 and EMA50
🔘EMA50 and SMA200
Solid Line = Stronger Resistance/Support
Dashed Line = Resistance/Support
Tập lệnh chỉ hiển thị cho người được mời
Chỉ những người dùng được tác giả đồng ý mới có thể truy cập tập lệnh này. Bạn cần yêu cầu và xin phép sử dụng tập lệnh này. Quyền truy cập thường được cấp sau khi thanh toán. Để biết thêm chi tiết, hãy làm theo hướng dẫn của tác giả bên dưới hoặc liên hệ trực tiếp với Hud_Hud.
TradingView KHÔNG khuyến khích trả tiền hoặc sử dụng tập lệnh trừ khi bạn hoàn toàn tin tưởng tác giả và hiểu cách hoạt động của tập lệnh. Bạn cũng có thể tìm thấy các giải pháp thay thế miễn phí, mã nguồn mở trong mục tập lệnh cộng đồng của chúng tôi.
Hướng dẫn của tác giả
Telegram Channel : t.me/HudHudAlert
TV Indicator : my.tradingview.com/u/Hud_Hud/
Thông báo miễn trừ trách nhiệm
Tập lệnh chỉ hiển thị cho người được mời
Chỉ những người dùng được tác giả đồng ý mới có thể truy cập tập lệnh này. Bạn cần yêu cầu và xin phép sử dụng tập lệnh này. Quyền truy cập thường được cấp sau khi thanh toán. Để biết thêm chi tiết, hãy làm theo hướng dẫn của tác giả bên dưới hoặc liên hệ trực tiếp với Hud_Hud.
TradingView KHÔNG khuyến khích trả tiền hoặc sử dụng tập lệnh trừ khi bạn hoàn toàn tin tưởng tác giả và hiểu cách hoạt động của tập lệnh. Bạn cũng có thể tìm thấy các giải pháp thay thế miễn phí, mã nguồn mở trong mục tập lệnh cộng đồng của chúng tôi.
Hướng dẫn của tác giả
Telegram Channel : t.me/HudHudAlert
TV Indicator : my.tradingview.com/u/Hud_Hud/