OPEN-SOURCE SCRIPT
KAIRI RELATIVE INDEX
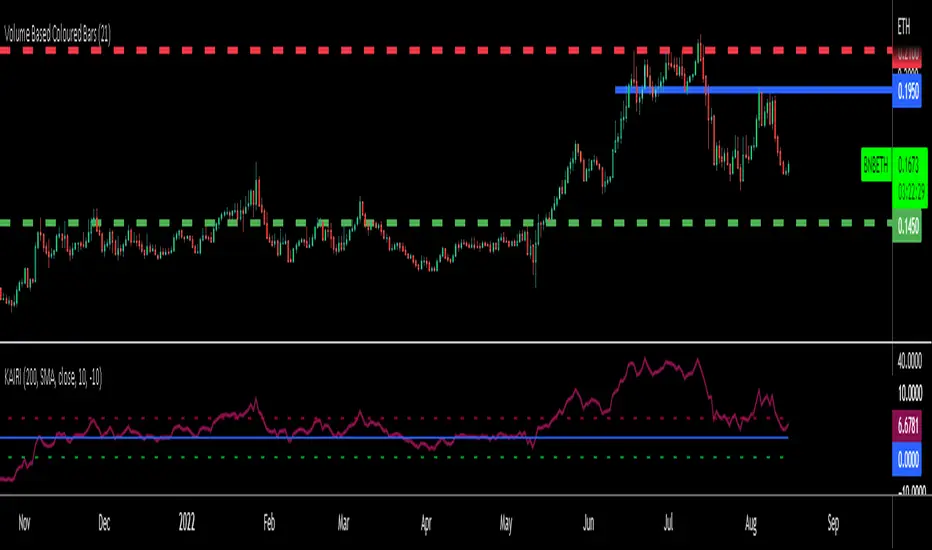
An old but gold Japanese indicator for Mean Reverting strategies and ideal for Pairs Trading...
The Kairi Relative Index measures the distance between closing prices and a Moving Average in percent value (generally SMA).
Extreme reading in the KRI are considered buy and sell signals.
Extreme readings will vary by asset, with more volatile assets reaching much higher and lower extremes that more sedate assets.
The KRI is not an accurate timing signal, and therefore, should be combined with other forms of analysis to generate trade signals.
You can calculate percent difference between the price and 10 different types of Moving Averages in this version of KAIRI as:
SMA : Simple Moving Average
EMA : Exponential Moving Average
WMA : Weighted Moving Average
TMA : Triangular Moving Average
VAR : Variable Index Dynamic Moving Average a.k.a. VIDYA
WWMA : Welles Wilder's Moving Average
ZLEMA : Zero Lag Exponential Moving Average
TSF : True Strength Force
HULL : Hull Moving Average
VWMA: Volume Veighted Moving Average
Personal advice: try using bigger length of Moving Averages like 50-100-200 for pairs and mean reversion strategies
Mã nguồn mở
Theo đúng tinh thần TradingView, tác giả của tập lệnh này đã công bố nó dưới dạng mã nguồn mở, để các nhà giao dịch có thể xem xét và xác minh chức năng. Chúc mừng tác giả! Mặc dù bạn có thể sử dụng miễn phí, hãy nhớ rằng việc công bố lại mã phải tuân theo Nội quy.
Telegram t.me/AlgoRhytm
YouTube (Turkish): youtube.com/c/kivancozbilgic
YouTube (English): youtube.com/c/AlgoWorld
YouTube (Turkish): youtube.com/c/kivancozbilgic
YouTube (English): youtube.com/c/AlgoWorld
Thông báo miễn trừ trách nhiệm
Thông tin và các ấn phẩm này không nhằm mục đích, và không cấu thành, lời khuyên hoặc khuyến nghị về tài chính, đầu tư, giao dịch hay các loại khác do TradingView cung cấp hoặc xác nhận. Đọc thêm tại Điều khoản Sử dụng.