OPEN-SOURCE SCRIPT
EMA with VWAP
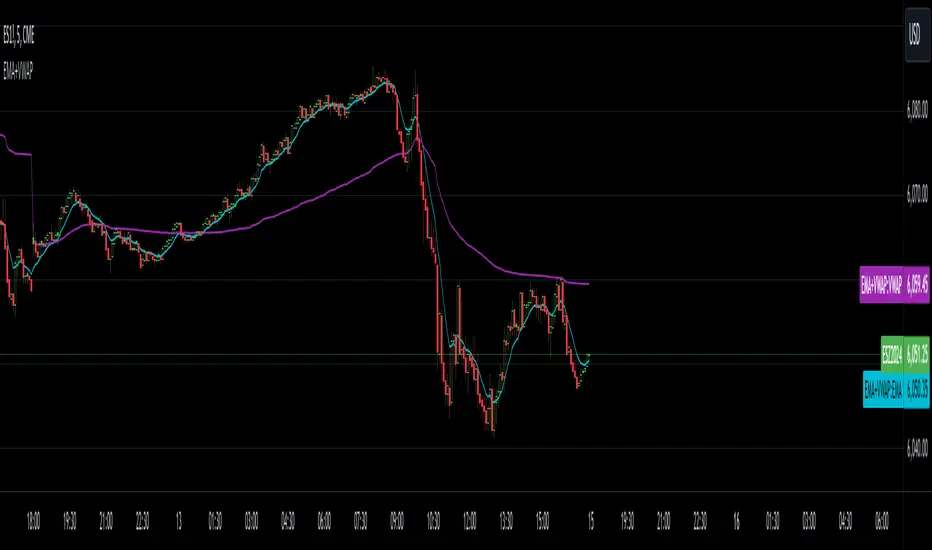
This indicator combines two popular technical analysis tools: the Exponential Moving Average (EMA) and the Volume Weighted Average Price (VWAP), into a single, powerful overlay on your chart. It allows you to analyze both trend direction using the EMA and institutional interest and fair value using the VWAP, all while saving valuable indicator slots on your TradingView layout.
Key Features:
- Exponential Moving Average (EMA):
- Calculates the EMA based on a user-defined Length and Source (e.g., close, open, hl2).
- Includes an optional Offset to shift the EMA line forward or backward on the chart.
- Offers a Smoothing Line feature, allowing you to further smooth the EMA using various moving average types (SMA, EMA, SMMA (RMA), WMA, VWMA) with a customizable Smoothing Length.
- EMA and Smoothing Line can be toggled on or off.
- EMA and Smoothing Line have independent offset capabilities.
Volume Weighted Average Price (VWAP):
-Calculates the VWAP, a crucial indicator that reflects the average price weighted by volume.
- Offers a wide range of Anchor Periods for resetting the VWAP calculation, including: Session, Week, Month, Quarter, Year, Decade, Century, Earnings, Dividends, and Splits.
- Includes an optional Offset to shift the VWAP line.
- Option to Hide VWAP on 1D or Above timeframes to focus on intraday analysis.
- Provides up to three customizable Standard Deviation Bands above and below the VWAP, visually representing volatility and potential support/resistance levels.
- Bands can be calculated using either "Standard Deviation" or "Percentage" methods.
- Bands can be turned on or off independently.
How to Use:
- EMA: Use the EMA to identify the overall trend direction. An upward-sloping EMA suggests an uptrend, while a downward-sloping EMA suggests a downtrend. The Smoothing Line can help confirm the EMA's trend.
- VWAP: The VWAP acts as a benchmark for the "fair" price of an asset during the selected anchor period. Prices above the VWAP may indicate bullish sentiment, while prices below may indicate bearish sentiment.
- Bands: The Standard Deviation Bands can help identify potential overbought and oversold conditions. Price reaching the upper bands might suggest overbought levels, while price reaching the lower bands might suggest oversold levels.
Customization:
- The indicator offers extensive customization through its settings:
- EMA Settings: Adjust the EMA length, source, offset, smoothing method, and smoothing length.
- VWAP Settings: Choose the VWAP anchor period, source, offset, and whether to hide it on daily or higher timeframes.
- VWAP Bands Settings: Control the visibility, multiplier, and calculation method for each of the three standard deviation bands.
Benefits:
- Consolidated Analysis: Combines two essential indicators into one, providing a comprehensive view of price action and volume.
- Saves Indicator Slots: Frees up valuable indicator slots on your TradingView chart.
- Highly Customizable: Offers a wide range of settings to tailor the indicator to your specific trading style and preferences.
- Visual Clarity: Clearly displays the EMA, VWAP, and optional bands on the chart, facilitating quick and easy analysis.
This combined EMA and VWAP indicator is a valuable tool for traders of all levels, offering a powerful and flexible way to analyze market trends and identify potential trading opportunities.
Mã nguồn mở
Theo đúng tinh thần TradingView, tác giả của tập lệnh này đã công bố nó dưới dạng mã nguồn mở, để các nhà giao dịch có thể xem xét và xác minh chức năng. Chúc mừng tác giả! Mặc dù bạn có thể sử dụng miễn phí, hãy nhớ rằng việc công bố lại mã phải tuân theo Nội quy.
Thông báo miễn trừ trách nhiệm
Thông tin và các ấn phẩm này không nhằm mục đích, và không cấu thành, lời khuyên hoặc khuyến nghị về tài chính, đầu tư, giao dịch hay các loại khác do TradingView cung cấp hoặc xác nhận. Đọc thêm tại Điều khoản Sử dụng.