OPEN-SOURCE SCRIPT
OHLC Means
Note: This indicator works only on daily timeframes.
The indicator calculates the OHLC averages for days corresponding to the day of the last displayed candlestick. For instance, if the last candlestick displayed is Monday, it calculates the OHLC average for all Mondays; if Tuesday, it does the same for all Tuesdays.
Customizable period: The indicator allows you to select the number of candlesticks to analyze, with a default value of 1000. This means it will consider the last 1000 candlesticks before the final displayed one. Assuming there are only five trading days per week, this corresponds to about 200 days. (not true for cryptos, you need to devide by 7)
Example scenario:
Today is Tuesday and we analyse NQ
By default, the indicator analyzes the last 1000 candlesticks (modifiable parameter).
Since there are five trading days in a week,
1000 ÷ 5 = 200
The indicator calculates the OHLC averages for the last 200 Tuesdays, corresponding to the past seven years. Of course it is not exactly 200 becauses the may be one tuesday where the market is closed (if christmas is on tuesday for instance)
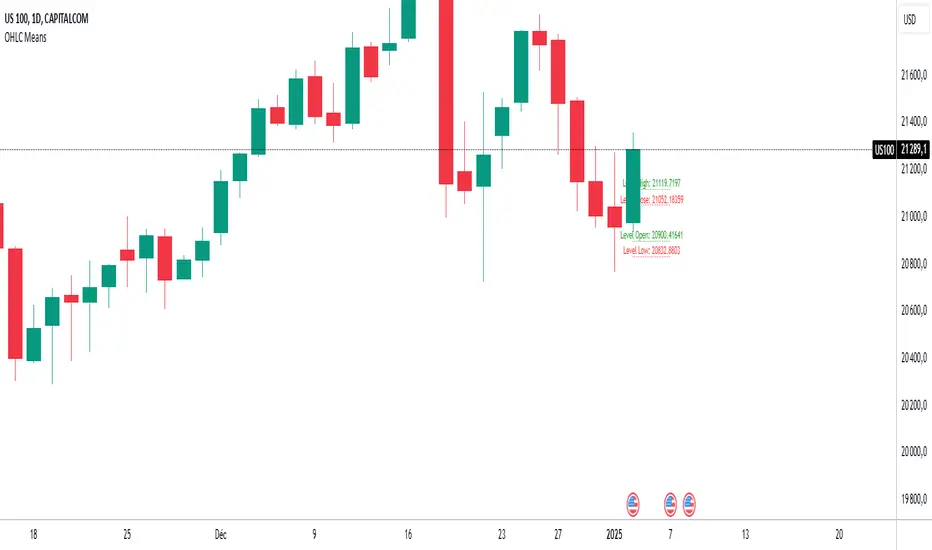
Output:
Displays four daily averages as four lines with their levels as labels :
High and Low averages are displayed at the extremes.
Open and Close averages are displayed at the center.
Color coding:
Red indicates bearish movement.
Green indicates bullish movement.
Usage recommendations:
Best suited for assets with a significant historical dataset.
Only functional on daily timeframes.
The indicator calculates the OHLC averages for days corresponding to the day of the last displayed candlestick. For instance, if the last candlestick displayed is Monday, it calculates the OHLC average for all Mondays; if Tuesday, it does the same for all Tuesdays.
Customizable period: The indicator allows you to select the number of candlesticks to analyze, with a default value of 1000. This means it will consider the last 1000 candlesticks before the final displayed one. Assuming there are only five trading days per week, this corresponds to about 200 days. (not true for cryptos, you need to devide by 7)
Example scenario:
Today is Tuesday and we analyse NQ
By default, the indicator analyzes the last 1000 candlesticks (modifiable parameter).
Since there are five trading days in a week,
1000 ÷ 5 = 200
The indicator calculates the OHLC averages for the last 200 Tuesdays, corresponding to the past seven years. Of course it is not exactly 200 becauses the may be one tuesday where the market is closed (if christmas is on tuesday for instance)
Output:
Displays four daily averages as four lines with their levels as labels :
High and Low averages are displayed at the extremes.
Open and Close averages are displayed at the center.
Color coding:
Red indicates bearish movement.
Green indicates bullish movement.
Usage recommendations:
Best suited for assets with a significant historical dataset.
Only functional on daily timeframes.
Mã nguồn mở
Theo đúng tinh thần TradingView, tác giả của tập lệnh này đã công bố nó dưới dạng mã nguồn mở, để các nhà giao dịch có thể xem xét và xác minh chức năng. Chúc mừng tác giả! Mặc dù bạn có thể sử dụng miễn phí, hãy nhớ rằng việc công bố lại mã phải tuân theo Nội quy.
Thông báo miễn trừ trách nhiệm
Thông tin và các ấn phẩm này không nhằm mục đích, và không cấu thành, lời khuyên hoặc khuyến nghị về tài chính, đầu tư, giao dịch hay các loại khác do TradingView cung cấp hoặc xác nhận. Đọc thêm tại Điều khoản Sử dụng.