OPEN-SOURCE SCRIPT
Cập nhật RSI with Close & Tail Divergences

RSI divergence is a cornerstone signal for both stock and cryptocurrency traders, renowned for its reliability.
The basis for measuring divergence can vary:
Depending on the criteria selected, the resultant signals can be markedly different.
Our innovative indicator offers:
With this tool, traders are empowered to make informed decisions, anchored in precise divergence cues.
This indicator boasts the following capabilities:

The basis for measuring divergence can vary:
- Historically, it's been determined by the candlestick's closing price.
- However, a contemporary approach uses the tail values, specifically the high and low prices, of the candlestick.
Depending on the criteria selected, the resultant signals can be markedly different.
Our innovative indicator offers:
- Divergence tracking based on the closing price of the candlestick.
- Divergence tracking considering the candlestick's peak and trough values.
- A unique convergence of both types of divergence signals.
With this tool, traders are empowered to make informed decisions, anchored in precise divergence cues.
This indicator boasts the following capabilities:
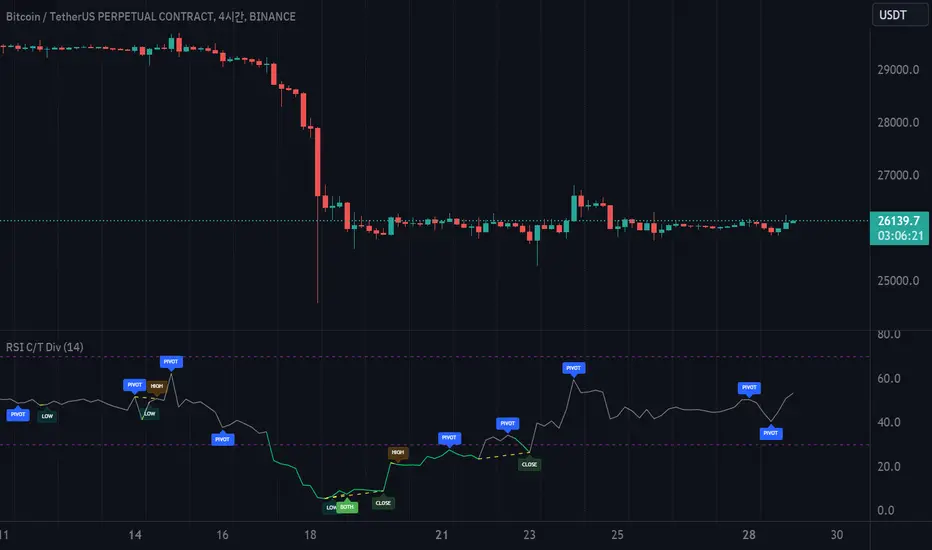
- Displays divergence based on closing price, highs/lows, as well as a unique combined criterion.
- Highlights pivot points.
- Denotes divergence spots on the RSI chart with lines.
- Offers a background color representation instead of labels.
Phát hành các Ghi chú
RSI divergence is a cornerstone signal for both stock and cryptocurrency traders, renowned for its reliability.The basis for measuring divergence can vary:
- Historically, it's been determined by the candlestick's closing price.
- However, a contemporary approach uses the tail values, specifically the high and low prices, of the candlestick.
Depending on the criteria selected, the resultant signals can be markedly different.
Our innovative indicator offers:
- Divergence tracking based on the closing price of the candlestick.
- Divergence tracking considering the candlestick's peak and trough values.
- A unique convergence of both types of divergence signals.
With this tool, traders are empowered to make informed decisions, anchored in precise divergence cues.
This indicator boasts the following capabilities:
- Displays divergence based on closing price, highs/lows, as well as a unique combined criterion.
- Highlights pivot points.
- Denotes divergence spots on the RSI chart with lines.
- Offers a background color representation instead of labels.
Mã nguồn mở
Theo đúng tinh thần TradingView, tác giả của tập lệnh này đã công bố nó dưới dạng mã nguồn mở, để các nhà giao dịch có thể xem xét và xác minh chức năng. Chúc mừng tác giả! Mặc dù bạn có thể sử dụng miễn phí, hãy nhớ rằng việc công bố lại mã phải tuân theo Nội quy.
Thông báo miễn trừ trách nhiệm
Thông tin và các ấn phẩm này không nhằm mục đích, và không cấu thành, lời khuyên hoặc khuyến nghị về tài chính, đầu tư, giao dịch hay các loại khác do TradingView cung cấp hoặc xác nhận. Đọc thêm tại Điều khoản Sử dụng.