OPEN-SOURCE SCRIPT
Cập nhật Ice Cream Volume Profile [Visible range]

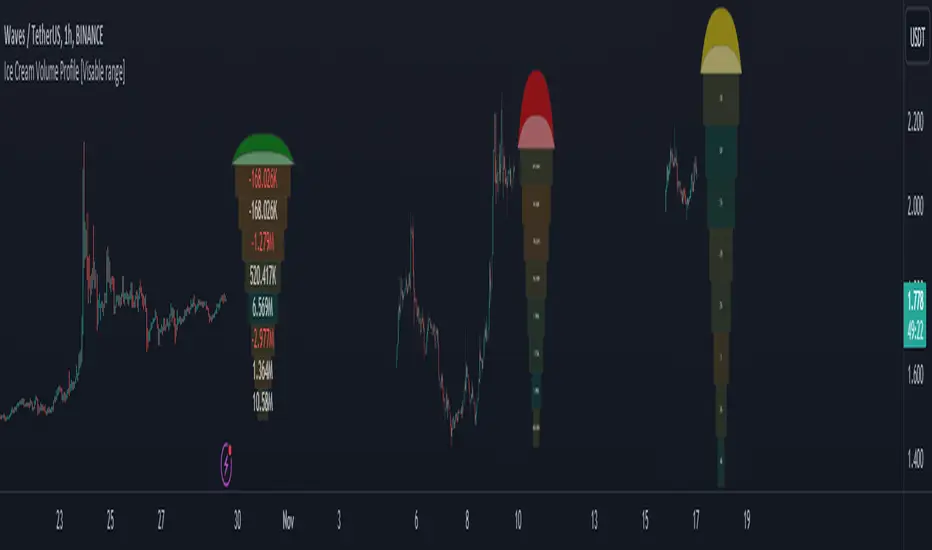
While exploring the new Pine Script feature, Polylines, I've created a fun project called the
Ice Cream Volume Profile for the visible range.
This fun project serves several purposes:
The top part of the ice cream cone changes color as follows:
Polylines are an excellent feature that enables us to create even more intriguing visuals in Pine Script.
Ice Cream Volume Profile for the visible range.
This fun project serves several purposes:
It displays the level at which the most trades (volume) occur.
It provides Delta volume information.
It counts how many times a bar closed within this level.
It assists in drawing support and resistance zones.
It aids in interpreting volume data.
The top part of the ice cream cone changes color as follows:
- Green: When the bullish volume exceeds 55% of the total volume.
- Red: When the bearish volume surpasses 55% of the total volume.
- Yellow: When neither Green nor Red exceeds 55% of the total volume.
Polylines are an excellent feature that enables us to create even more intriguing visuals in Pine Script.
Phát hành các Ghi chú
Minor name changeMã nguồn mở
Theo đúng tinh thần TradingView, tác giả của tập lệnh này đã công bố nó dưới dạng mã nguồn mở, để các nhà giao dịch có thể xem xét và xác minh chức năng. Chúc mừng tác giả! Mặc dù bạn có thể sử dụng miễn phí, hãy nhớ rằng việc công bố lại mã phải tuân theo Nội quy.
Links : linktr.ee/tzacks
Thông báo miễn trừ trách nhiệm
Thông tin và các ấn phẩm này không nhằm mục đích, và không cấu thành, lời khuyên hoặc khuyến nghị về tài chính, đầu tư, giao dịch hay các loại khác do TradingView cung cấp hoặc xác nhận. Đọc thêm tại Điều khoản Sử dụng.
Mã nguồn mở
Theo đúng tinh thần TradingView, tác giả của tập lệnh này đã công bố nó dưới dạng mã nguồn mở, để các nhà giao dịch có thể xem xét và xác minh chức năng. Chúc mừng tác giả! Mặc dù bạn có thể sử dụng miễn phí, hãy nhớ rằng việc công bố lại mã phải tuân theo Nội quy.
Links : linktr.ee/tzacks
Thông báo miễn trừ trách nhiệm
Thông tin và các ấn phẩm này không nhằm mục đích, và không cấu thành, lời khuyên hoặc khuyến nghị về tài chính, đầu tư, giao dịch hay các loại khác do TradingView cung cấp hoặc xác nhận. Đọc thêm tại Điều khoản Sử dụng.