OPEN-SOURCE SCRIPT
TP Hunter [Sniper Trading System]
TP Hunter Overlay — Sniper Trading System Suite
What it is
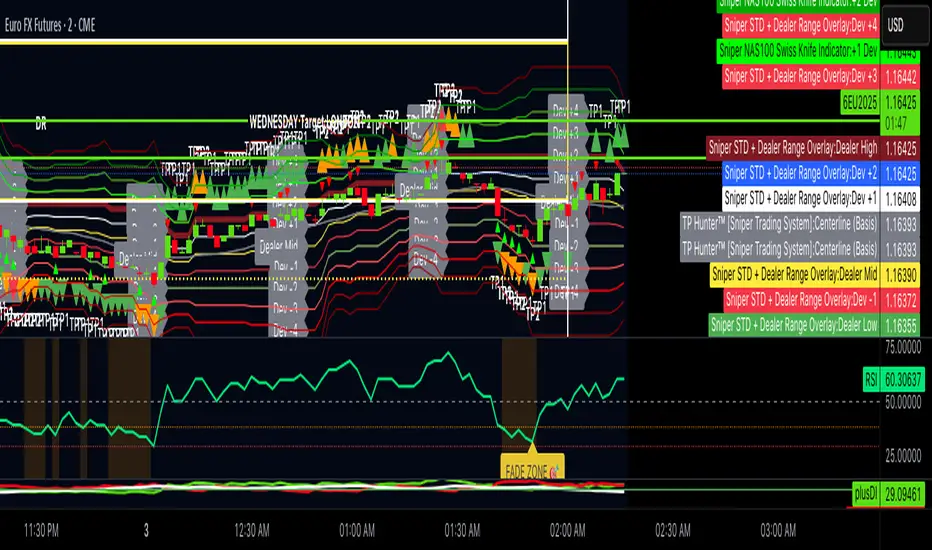
TP Hunter helps with the hardest part of trading: exits. It plots Take Profit zones (TP1/TP2/TP3) using a standard deviation model around a 20-period moving average (“Centerline”). When price reaches a target, TP Hunter marks it on the chart and can trigger an alert—so you can scale out with discipline.
How it works (plain language)
The Centerline is a 20-period SMA (average price).
The script measures recent volatility (standard deviation) and projects TP levels above/below the Centerline.
If price is above the Centerline, the script treats it as buy context; below = sell context.
When price touches a TP level in that context, the indicator prints a shape (TP1 green, TP2 orange, TP3 red) and alerts can fire.
Inputs
TP1/TP2/TP3 Multiplier: distance of each target from the Centerline (in standard deviations).
RSI Period / Levels: optional filter to avoid extreme conditions (default enabled).
Show TP Hit Labels: toggle the on-chart labels.
Visuals
Centerline (gray)
TP hits:
Buy hits = triangles above bars (TP1/TP2/TP3 = green/orange/red).
Sell hits = triangles below bars (TP1/TP2/TP3 = green/orange/red).
Alerts
TP1/TP2/TP3 hit alerts for both buy and sell contexts.
Suggested workflow: set alerts, scale out at TP1/TP2, reserve a runner for TP3.
Best practices
Use TP Hunter to plan exits after your own entry signal (e.g., time-based or liquidity-based entries).
If you want fewer but stronger targets, increase the multipliers.
If you want more frequent targets, decrease them slightly.
RSI filter can reduce noise during extreme momentum.
Notes & Limitations
This is an overlay tool for exit management, not a standalone entry system.
Shapes confirm on bar close; alerts can trigger intrabar when a level is touched.
No financial advice. Past performance does not guarantee future results.
What it is
TP Hunter helps with the hardest part of trading: exits. It plots Take Profit zones (TP1/TP2/TP3) using a standard deviation model around a 20-period moving average (“Centerline”). When price reaches a target, TP Hunter marks it on the chart and can trigger an alert—so you can scale out with discipline.
How it works (plain language)
The Centerline is a 20-period SMA (average price).
The script measures recent volatility (standard deviation) and projects TP levels above/below the Centerline.
If price is above the Centerline, the script treats it as buy context; below = sell context.
When price touches a TP level in that context, the indicator prints a shape (TP1 green, TP2 orange, TP3 red) and alerts can fire.
Inputs
TP1/TP2/TP3 Multiplier: distance of each target from the Centerline (in standard deviations).
RSI Period / Levels: optional filter to avoid extreme conditions (default enabled).
Show TP Hit Labels: toggle the on-chart labels.
Visuals
Centerline (gray)
TP hits:
Buy hits = triangles above bars (TP1/TP2/TP3 = green/orange/red).
Sell hits = triangles below bars (TP1/TP2/TP3 = green/orange/red).
Alerts
TP1/TP2/TP3 hit alerts for both buy and sell contexts.
Suggested workflow: set alerts, scale out at TP1/TP2, reserve a runner for TP3.
Best practices
Use TP Hunter to plan exits after your own entry signal (e.g., time-based or liquidity-based entries).
If you want fewer but stronger targets, increase the multipliers.
If you want more frequent targets, decrease them slightly.
RSI filter can reduce noise during extreme momentum.
Notes & Limitations
This is an overlay tool for exit management, not a standalone entry system.
Shapes confirm on bar close; alerts can trigger intrabar when a level is touched.
No financial advice. Past performance does not guarantee future results.
Mã nguồn mở
Theo đúng tinh thần TradingView, người tạo ra tập lệnh này đã biến tập lệnh thành mã nguồn mở để các nhà giao dịch có thể xem xét và xác minh công năng. Xin dành lời khen tặng cho tác giả! Mặc dù bạn có thể sử dụng miễn phí, nhưng lưu ý nếu đăng lại mã, bạn phải tuân theo Quy tắc nội bộ của chúng tôi.
Thông báo miễn trừ trách nhiệm
Thông tin và ấn phẩm không có nghĩa là và không cấu thành, tài chính, đầu tư, kinh doanh, hoặc các loại lời khuyên hoặc khuyến nghị khác được cung cấp hoặc xác nhận bởi TradingView. Đọc thêm trong Điều khoản sử dụng.